Saturday, May 27, 2006

Move Over Who?: Part IX

I received some new comments in the following blog posting Move Over Who?: Part VIII

  • I just downloaded the Q1/2006 report and noted that Karensoft had actually reported a Q1/2006 profit. Perhaps their strategy of focussing on ERP4Auto is paying off ?

  • However, I am puzzled why you did not mention that Karensoft reported a Q1/2006 profit ?

    I downloaded the Q1/2006 and the 2005 accounts and running through the GN3 Guidelines, I cannot understand why Karensoft was clasified as a GN 3 company as they pass all the tests as a Group and should not be classified GN 3.

    The only thing that could hit them would be 2.1 (b) & (c) where the accounts of the listed company alone are considered. I noticed that there was an impairment loss of about 9 Million charged to the P/L of the holding company and not the group. As far as I know, FRS 136 on Impairment of Investments should only be efffective 1/1/06

    Could it be that Karensoft has been penalsied for early compliance with FRS 136 ?

Yes, by not posting a new follow-up article on Karensoft probably might leave some readers thinking that I am truly biased against some stocks and more so biased against Karensoft since it did report a profit recently.

Anyway, I do hope very much that you do understand that this is a mere personal blog of mine, mumblings of my opinions and views on stocks from an investing point of view. It's really a general blog, hence unless there is an request, I do not feel I have the need and the obligation to follow-up on every issue of every stock I have mumbled on before. Some has even posted ugly comments that I sound like a broken tape recorder when I have kept repeating blog postings on a same stock.

Firstly, for some strange reason, I could not open the pdf file attachment from their latest quarterly earnings posted on Bursa website.


Could someone confirm if they can open the above pdf file attachment link?

Anyway, I will have to rely on Karensfot's Investion Relation (IR) website: here

Now Karensoft was listed back in 2003. Karensoft has been losing money each single year since it was listed. ( see here )

  • FY 2003: Loss 0.595.17 million
  • FY 2004: Loss 3.930 million
  • FY 2005: Loss 10.809 million

The latest earnings, 2006 Q1 saw Karensoft reported a profit. A new year, a new beginning. So how did Karensoft do?

  • A sales revenue of 0.593 million.
  • A net profit of 0.101 million.

A profit of 101 thousand from sales revenue of 593 thousand???

Hardly impressive at all!

Considering its past torrid history and also the incredible chain of events when Karensoft was proudly proclaimed by a local brokerage house that its Execsuite software could rival the mighty M'soft's Office Suite software and how the stock tumbled dramatically a couple of months after that recommendation, its performance wasn't too impressive, yes?

And the following issue is even more mind-boggling. Have a look at the following screen-shot of this webpage, http://ir.wallstraits.net/karenSoft/page.php?id=profit_loss
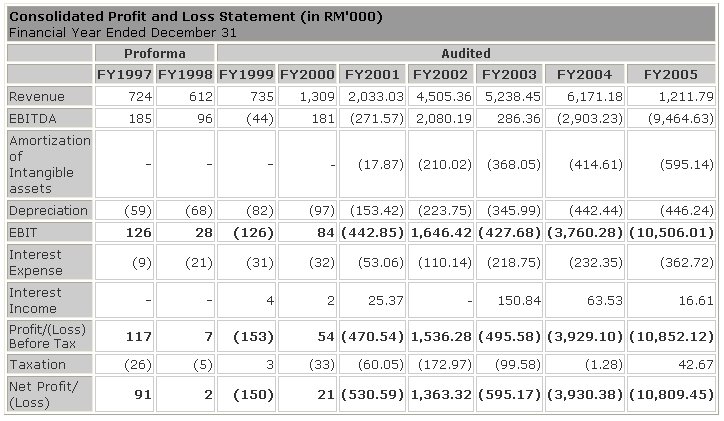
Simple exercise.

Add Karensoft total sales revenue since listing in 2003.

Add Karensoft's sales revenue since listing in 2003 and you will get total sales of 12.627 million.
Add Karensoft's total losses since listing in 2003 and you will get total losses of 15.334 million!!

And consider the fact that Karensoft stated that these losses were derived from provision of doubtful debts.

So how does a business accumulate so much doubtful debts?

Now I do reckon that this is one really interesting issue for all. Any conspiracy theories?

How?

Anyway, had you not request commentary on this stock, perhaps some might even accuse me for promoting the stock and making insinuation that perhaps Karensoft is on its way in turning around its business.

But of course, one can argue Karensoft has made a profit and no matter how small that profit is, a profit is still a profit. And since it has made a profit, there is a chance that this could very well be the start of a brand new Karensoft.

True, very true but surely one of question how sustainable is such earnings. A profit of 101 thousand from a sales revenue of 593 thousand is really peanuts and such performance is really shockingly poor considering the fact that Karensoft is a listed company!

And from its IR website, Karensoft's current balance sheet shows a cash balance of 2.943, while its total borrowing totals some 5.453 million (net debt 2.510 million) with accumulated losses of 15.371 million!

Isn't Karensoft in such an appalling state?

And consider this issue. Based on a quarterly profit of 101 thousand, it would require 152 quarters of similar earnings to erase that accumulated losses of 15.371 million in its balance sheet!!! And 152 quarters equates to some 38 years!!!!!!!

See why I had not made an effort in making a blog posting stating the fact that Karensoft reported a profit for its latest quarterly earnings? Should I make a positive blog posting? Or should I make yet another cynical posting on Karensoft? Well if I had made a positive posting on Karensoft based on these facts, perhaps some might get some wrong idea that perhaps I am trying to pull a funky stunt here and promote Karensoft based on some personal vested reason!! And on the other hand, if I was cynical again, some might even accuse that I have some real serious personal hatred against Karensoft!

How?

Regarding the GN3 thingy. Does it even matter? Say Karensoft has been wrongly classified as argued. Does Karensoft even have any investment merits at all?

* past blog postings can be found here:

Karensoft
Karensoft: Part II
Karensoft: Part III
Karensoft: Part IV
Karensoft: Part V
Karensoft: Part VI
Karensoft: Part VII
Karensoft: Part VIII

Friday, May 26, 2006

Regarding Success Transformer

  • Could you share some opinion on Success Transformer

To be honest, when Success Transformer was listed early last year, I was rather biased against this company, for I felt that perhaps the name of this company was perhaps a bit goofy. It was like if the company was a success, why did it need to transform? That was my initial reaction and perhaps I should have taken a little time to research the story behind the company. Star Biz carried a wonderful story on the company background: Tan tansforms from fruit seller to factory owner . And the following article, Transformer maker charges abroad , describes what Success Transformer does.

  • Its products include transformers, automatic voltage stabilisers, power line conditioners, high-intensity discharged ballasts and industrial lighting products like floodlights, high-bay and street lightings.

    Success Transformer exports to 18 countries including Singapore, Cambodia, Brunei, Bangladesh, Thailand, Japan, the United Arab Emirates, Australia, New Zealand, Indonesia and Thailand.

An electrical products industry player. This is an industry which I am not too familiar with.

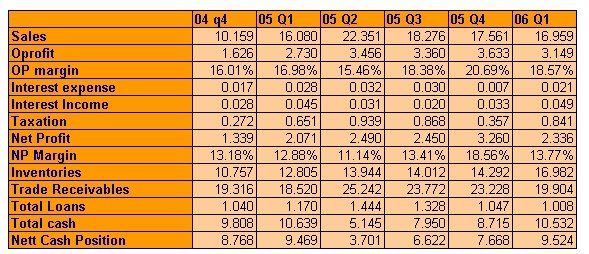
Since it was listed only in Jan 2005, there is simply enough data to pass judgement on this stock and the best I can offer is a compilation of what the company has done since listing.

The initial numbers do look decent and what impresses me is how the company has maintained its cash balances. I would assume that this is due to the owner's humble beginning.

Current earning is around 10.536 million and its current share base is 80 million shares.

Oh, I note also that OSK coverage on it. And the following is a snippet of what it wrote.

  • No too bad. STC reported a 5.5% y-o-y increase in sales, from RM16.1m in 1Q05 to RM17.0m as a result of higher volume in the domestic market during the period (refer Figure 5 for comparison between 1Q05 and 1Q06). PBT on the other hand, grew by a surprising 15.7% y-o-y with EBIT margins improved by 1.6 percentage point y-o-y to 18.6%.
  • ... Just a tad lower. Annualizing 1Q, top line of RM67.84m was 17.0% lower than our estimates. Our FY06 sales estimates are based on management guidance of a 10% organic growth rate. Although revenue did decline 3.4% q-o-q, we foresee this to pick up by mid-2006. We observed there to be a mild cyclical trend that dips towards the end of the year, and peaks in the middle of the year (refer Figure 4). The lower sales trend in 4Q is a result of shorter operation periods throughout festive seasons. Therefore, we anticipate a better performing 2Q, bringing STC's performance closer to our estimates.
  • Growth plans going forward. STC intends to expand its business geographically (target markets include Bahrain, Qatar, UK and Uzbekistan), widen its product range and venture into upstream supporting activities in the coming years to boost profitability. Also, STC's RM3.3m investment in solar related products and equipment upgrades last year is expected to boost its industrial lighting segment, which takes up about a third of its sales (refer Figure 2) by an additional 5%.
  • Mini treats to mark 1 st year listing. STC distributed 15.5% of its net profits as dividends in FY05, equivalent to a 2.3% yield based on its current share price. For our projection, we have tagged a payout ratio of 30% translating to a potential yield of 4.2-4.6%.
  • Good Catch. Based on a guided revenue growth and sustainable margins, STC is trading at an attractive FY06 PE of 6.2x . We believe the stock is attractively priced compared to the industry average of 8.25x. We also like STC for its edge over industry competitors due to economies of scale in production, as well as its extensive product distribution. Pegging our valuations to the industry average, we arrive at a target price of RM1.17 , equivalent to a 33% upside .

Hope all this helps. Just for your information, OSK fy 2006 net earnings for Success is based on a projected earnings of 11.3 million.

Cheers

Thursday, May 25, 2006

TITANic Bull Again?

Titan Chemicals announced its earnings yesterday. And this is how Titan has performed since listing.

2005 Q1 net profit 159.3 million (not listed yet)
2005 Q2 net profit 111.326 million.
2005 Q3 net profit 71.924 million.
2005 Q4 net profit 19.282 million.
2006 Q1 net profit 378.070 million.

The earnings look rather decent and it got some of the local news all excited. The Business Times has this header:
Titan Chemicals Q1 net more than doubles ; while the Star Business has this header: Titan first quarter profit up 149% to RM378m

Now the issue is 'the inclusion of a RM341mil non-recurring income from consolidation of its acquisition of PT Titan' which is nothing but mere accounting profit.

And if you minus this 341 million out, this is how Titan did since listing.

2005 Q1 net profit 159.3 million (not listed yet)
2005 Q2 net profit 111.326 million.
2005 Q3 net profit 71.924 million.
2005 Q4 net profit 19.282 million.
2006 Q1 net profit 37.070 million.

Which isn't all that bad but what irks me the most was mentioned in my initial blog on
Titan.

Now this is a company which sold itself to the investing public based on a repeated promise that it would earn some 604 million for its fiscal year 2005!

And how is Titan doing?

Oh, for those who like figures, let me be really cynical. Say we give Titan a helping hand, yeah spot the bugger a handicap of one extra quarter earnings. Guess what? If we add up these 5 quarterly earnings, Titan only earned 398.902 million. How? Can you imagine that with one extra quarterly earnings, Titan earnings is still no where close to the 604 million it promised during its IPO!!!!!!

Oh and the trailing earnings is a mere 239.602 million!

Yes, it is not easy making an earnings projection but when the projected earnings is so way off as in the example of Titan, it really makes you wonder. And worse still, those poor ipo investors bought Titan based on these incredibly optimistic earnings projections!

So how about the SC coming down really hard on buggers who make such incredibly optimistic earnings projections?

How brown cow?

Chat on Opcom Holdings

Here are some opinions which I hope are useful as some second opinion (my comments is in black).

Hi Moola,

Here are my opinions on OPCOM.

1. Management

  • Very "heavy" political background.
  • I don't like those types of companies. But from Opcom's operating history since it's listing, everything looks still promising.
  • If the management is honest as such, with it's "heavy" political background, should give positive impact to Opcom'' future growth.

a. Stocks with strong political background do have some risk. When they are politically in favour, then it bodes well for the stock. But do remember, this works both ways.

b. Opcom Holdings operating history. Opcom Holdings was listed in Dec 2003. Perhaps it is more prudent to look at what Opcom Holdings has done since listing.

fy 2004: Sales 58.084 million. Net profit 10.574 million.
fy 2005: Sales 78.291 million. Net profit 17.198 million.

The numbers looks impressive so far but remember Opcom is still relatively new and for some, they do reckon that it is way too early to pass judgement on Opcom with such few data.

And what do their current/trailing earnings suggest?

Sales 73.424 million. Net profit 13.599 million.

This is suggesting that Opcom current fiscal year won't be as happening as its 2005 fiscal year and it also suggest that perhaps Opcom's business is rather volatile.

c. Management? Some like to use how the management commentary after each quarterly earnings as an indicator to gauge their integrity, while some like to use interviews in the papers as an indicator. There is no real right or wrong since this issue represents one own perception.

Anyway, let's look at the early days for Opcom. Let's go back to May 2004.

Reporting Quarter: 2004 Q4 Earnings

On a Q-Q basis: sales went from 13.946 to 6.507 million.
On a Q-Q basis: net profit went from 2.958 million to 1.469 million.

Hardly impressive and in fact it is perhaps rather worrying. No?

here is what the company said in its earning notes...

  • For the current quarter, the Group achieved revenue of RM 6.5m and a profit before tax of RM 1.9m. On the year to date basis, the Group achieved a revenue of RM 58.1m representing a growth of 26% as compared to RM 46.0m in the preceding year. As a result of the higher revenue, the profit before taxation has also increased by 40% to RM 17.4m as compared to the preceding year of RM 12.4m. The growth was mainly due to the increase in demand and economies of scale.

    There was a decrease of 53% in the Group's revenue i.e. from RM 13.9m to RM 6.5m in the current quarter. The decrease was mainly due to the decrease in demand in the current quarter as compared with the significantly high demand in last quarter.

    However, the Group's profit before taxation has only decreased by 34% i.e. from RM 2.9m to RM 1.9m in the current quarter. The steady profit before taxation despite low revenue was mainly due to decrease in administrative expenses.

Decent explainations but there is a slight problem here. Now each Mess-daq company are required to write a research note describing the company's performance and prospect.

Take a look at the following: Opcom Holdings Berhad Research Report. In that link there's a pdf file attachment. Have a read.

How? Do you see how the management totally ignored the current reported quarterly earnings? And it made NO effort in describing the POOR QUARTERLY EARNINGS. Instead, the company posted its nice track record which is really irrelevant since it represented a period when Opcom was NOT listed in the exchange. Everything was presented in a nice table, and it showed off its growth thingy and talked about irrelevant yardsticks such as EBITDA, its EBITDA margin, its EBITDA growth....

So how? How would u rate such a company management?

2. Product portfolio

  • It's core biz is producing fiber optics as the backbone for broandband, 3G, mainly on ICT.
  • In Malaysia, this biz future looks bright as the penetration rate still low and has big room to growth. But, I have no idea how many fiber optics players are they in Malaysia, and what are the competitive advantages of Opcom.

Way back in 2003, there was this commentary from this independant advisor, Surf 88.

  • More than 60% domestic market share. On the back of the indirect contract with Telekom, Opcom has emerged as the major supplier of Telekom’s fibre optic cables requirement, so much so that it is estimated to have supplied 65%-75% of domestic telecommunication needs in the past five years. To some extent, this has ‘crowded out’ the other two major players, Leader Optic Fibre Cable Sdn Bhd, a subsidiary of Leader Universal (RM0.61, stock code 4529) and Fujikura Federal Cables Sdn Bhd. In turn, Telekom accounted for 98.3% of Opcom’s revenue in the latest six months to Sep 2003.

Two issues from that paragraph.

1. There are two competitors. Leader Optic Fibre cables and Fujikura Federal Cables..
2. Opcom's (who controls 60% market share) main source of revenue is Telekom.

How would you rate such a business economics?

Opcom has to challenge two other players in the market for its bread and butter.

Customer Based

  • Secured RM171.4mil contract from TM, last until 1Q 2007. Est. yearly revenue = RM 60mil.
  • New contract from TM, 3 years from 9/11/05 – 8/11/08, worth RM 17.3 mil, or RM 5.8mil/year.
  • RM 2.5mil from TNB, dated 28/2/06, end supply by end 2006.
  • 18/4/06, RM16mil contract from Multinet Pakistan, supply end 2006.
  • Agreement with Erricson & Maxis, but no commitment on revenue.
  • Others overseas customers, which Opcom claims.

Ys, Opcom is making an effort to correct its single customer business structure.

Financial aspects

  • Strong earning & growth since listed until 2005.
  • Net cash position, FY2005 Net Asset Cash Value (NACV) at RM0.35 per share.
  • High profit margin & improving (until FY2005)
  • Good DY to reward shareholders

Opcom reported its 2006 Q4 quarterly earnings and it was a pretty horror showing, which paints a totally new picture on how Opcom has done since its listing.

  • fy 2004: Sales 58.084 million. Net profit 10.574 million.
  • fy 2005: Sales 78.291 million. Net profit 17.198 million.
  • fy 2006: Sales 67.795 million. Net profit 10.866 million.

Which seriously questions the issue of strong earning & growth since listed until 2005!

And this is what the company had to say.

  • For the quarter under review, the Group registered a revenue of RM6.8m and profit before taxation of RM1.2m as compared to RM12.4m and RM2.6m respectively in the preceding year's corresponding quarter. The lower revenue and profit before taxation recorded by the Group were mainly due to lower sales of fiber optic cables compared to the preceding year's corresponding quarter.

Satisfactory answer for the poor result? If no, remember the issue of management integrity?

Doubts:

  • Why Opcom still owing it's director since it can actually pay off the debts at any time?
  • What is Minority Shareholders' Interest? Why keep on increasing? Will this give negetive impact to Opcom?
  • Director's remuneration & fees increased from RM 235,500 to RM 766,094. What will it be in FY2006? Especially for the two key persons…

Minority interest is quite simple actually. Say Opcom owns quite substantial shares in a company called PoPo. And Opcom shareholding in it is only 70%. 30% belongs to someone else. Now if PoPo directly contributes to Opcom's business earnings, for accounting purposes, Opcom has to account for that 30% interest in PoPo which doesn't belong to it. So, Opcom has to minus the amount from the profits. So why does this amount keep increasing? Simple reason is PoPo is adding more earnings to Opcom's bottomline.

Concerns

  • Opcom currently too depends on TM.
  • Decreased in EPS, profit margin for cumulative 3Q 2006. How far will this goes…??
  • Engage with Erricson to provide Opcom technology transfer. How much will it cost and how much profit can it contribute to Opcom..???

The decrease in EPS is a serious issue isn't it? And yesterday's quarterly earnings confirms the issue.

Buying points:

Relatively low PE. Based on annualized EPS FY06, it is trading at 6.7 times.

Estimated revenue for FY07:

  • TM contract on 7/2/04, ended 6/2/07 = RM 60mil/year
  • TM contract on 9/11/05, ended 8/11/08 = RM 5.77mil/year
  • TNB contract on 28/2/06 = RM 2.5mil/year
  • Multinet contract on 18/4/06 = RM 16mil/year
  • Others = RM 18mil (by deducting RM60mil TM contract from FY05 revenue of RM78mil)
  • Total estimated Revenue FY07: RM 102.27 mil.
  • Assumed 17% net profit: RM17.38mil. > EPS: 13.47, PE: 5.4

But, after FY07, when the biggest contract from TM end…. ???

Hope these second opinions helps.

Cheers!

Tuesday, May 23, 2006

What I think of MTD Capital?

  • wat do u think of MTD itself....

Anon,

I have done 2 blog postings on MTD b4.

Click on this link called
Map of mublings under the section called Archives on the left of the blog.

Search for the following 2 postings on it:
MTD Capital and MTD Capital & ACPi

RNAV valuation is usually used when one is looking at a holding company, which own substantial shares in other listed companies.

For example, say MTD owns shares in company A and company B.

So first they calculate the value o MTD shareholding in company A. And to calculate it, you multiply the number of shares MTD has in company A x the fair price of A.

Example: If MTD has 200 million shares in company A. And assuming the fair value of A is derived to be 1.00 then the value of MTD's shareholding in A is 200 x 1 = 200 million.

And then you do the same for company B.

And then you add both values up. And then divided by the current number of shares MTD has.

So where and how such valuations could go wrong? Well, one has to safely assume the fair value of company A and company B. And assuming one is successful in navigating such a task, one is then has to make another assumption. What is the discount to this RNAV which is deemed fair? For me, I find so complex. It's one assumption over another assumption over another assumption.

And for MTD, at this moment of time, it gets even more complex as MTD warrants has just expired, which means one does not know exactly how warrants will be converted into MTD shares. Which means one does not know for sure how many shares MTD will has in the near future. And if so, what is the RNAV of MTD?.

See the fuzziness of all this?

And if that is not enough, MTD has flip-flop its construction earnings to one of its subsidiary company? Which means unless we see some earnings report from this group of companies, everything will be extremely fuzzy?

And to compound things even more, MTD Capital has been making losses dues to provisions. So what can one expect? Yes, if we treat those provisions as a one-off issue MTD is making some money but on the other hand, how sure they will be no more provisions?

So isn’t this a complicated and complex situation?

Wouldn't it be more prudent if one adopts a wait-and-see approach until we know what is happening?

Like some folks say, why take a difficult betting option when there are easier and more viable betting option?

By the way, MTD Capital's corporate governance is pretty poor. Yes, one can assign hefty discount values to account for their poor corporate governance but do realise poor corporate governance remains poor corporate governance and it makes no difference in regardless of how much discount you apply for safety precaution (say isn't it more safe to avoid it totally? ) for at the end of the day they remain poor corporate governance.

Last but not least, these are my opinions of this stock as requested. If you think my reasonings is wrong, then it is wrong ok? Please make sure your own judgement and reasoning is sound in your own investing decisions. My opinions are mere second opinions.

Cheers!

Regarding RUB

  • Could you share your opinion on RUB and explain why pe ratio so low?

First of Ranhill Utilities was listed in the exchange back in 2002 (ipo price was 2.50). And based on the reported earnings, its current 4 quarters earnings totals some 125.690 million, its current earnings per share is 42.7 sen. And based on a closing price of 1.34, it is trading at a current pe multiple of only 3.13x.

So yes, RUB is trading at a very low PE ratio.

Firstly, to understand why the PE ratio is so low, perhaps we need to understand the PE yardstick. The PE yardstick merely indicates how the stock is trading in the market when compared to its earnings. And of course it gets complicated when one uses the yardstick in an advanced manner by using a projected (forward) earnings. And some even base the earnings on a projected 2 years earnings into the future. Which of course could get pretty complicated and the accuracy of the projection is always very subjective for one is forecasting the future earnings.

Anyway, the most important thing to remember is the yardstick measures how the stock is trading on the market when compared to its earnings.

And the most important thing is that one needs to realise that the yardstick does not indicate the quality of the stock!

Meaning to say, stocks trading at a low PE multiple does not necessary mean that this is a good stock and neither does it necessary mean that it is the hidden gem. As the saying goes, never say I ass-u-me!

Before continuing, one thing I would like to point out is that perhaps you should look at how RUB has performed since listing.


How? Doesn't it appear that the stock is on a clear decline?

So what is wrong with this stock?

The company is reporting more earnings than ever and based on the current earnings of 125.690 million, the company could be on track to record its best ever earnings but yet the stock is decling even more!

Has the market got this stock really wrong or is the market correct and that this stock has some serious issues which is causing investors to avoid it like plague?

Perhaps we could get a better understanding if we take a good look at RUB earnings and its balance sheets.

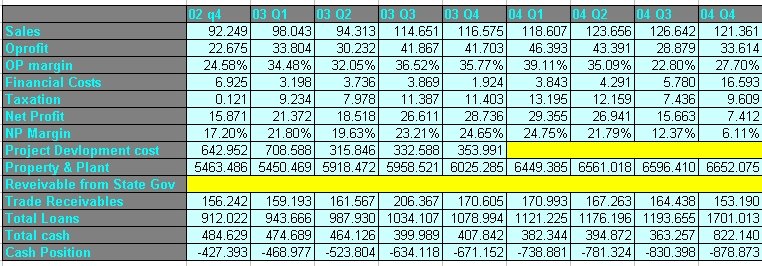
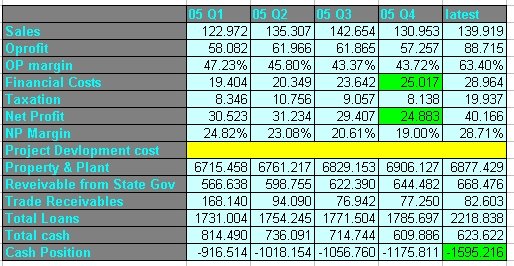
The below two tables represent the compilation of RUB quarterly earnings since its listing.


1. Just for the record, did you know that RUB reported it has earned some 346.692 million since its listing? (this figure is derived if you add the total of net profit in both tables)

So for a company generating so much 'wealth' what does an investor get?

2. The last row indicates the cash position (total cash - total loans) of the company. At the first column, RUB's 02 Q4 earnings, RUB was in a net debt position of 427.393 million. Look at the latest column; it states that RUB is now in a net debt position of 1595.216 million. WOW!

3. Debts. Look at the very last column. Total loans now total some 2218.838 million. WOW!

4. Now let's put this debt into perspective. Look at the 05 Q4 quarterly earnings. See the two green boxes. The financial cost for that quarter totals more than its earnings! And if you add the most recent 4 quarters financial cost, RUB paid 97.972 in financial costs!

5. When RUB first reported its earnings, it has this entry called 'project development cost' under its current asset. This went on from 02 Q4 to 03 Q4. And the next four quarters, this project development cost disappears and my guess it is lumped under 'property and plant'. And what is even more interesting that in 05 Q1, there is now an entry called 'receivable from State Govt'. In 05 Q1, this amount was 566.638 million. The latest? 668.476 million! WOW!

So from RUB listing till now, what wealth has it generated?

Ah, this is a very important issue. Some call it gauging the quality of a company's earnings.

What kind of wealth has RUB generated since it reported earnings totaling some 346.692 million since listing?

Well, its property and plant seems to be worth more. State govt owed them more money.

But most important, the very bottom line is that it is now in a net debt of 1595.216 million!

Do you see any wealth at all?

If the answer is no, then the quality of RUB's earnings and the quality of the management is seriously in question.

And if you put all this into perspective, isn't it clear why RUB is trading at such a low PE multiple?

And if that is the case, does it make sense risking your hard earned money in this stock?

How?

Btw, if not mistaken, I have read it before that RUB will not be paying any dividends till 2012!

Last but not least, these are my opinions of this stock as requested. If you think my reasonings is wrong, then it is wrong ok? Please make sure your own judgement and reasoning is sound in your own investing decisions. My opinions are mere second opinions.

Cheers!

Monday, May 22, 2006

Regarding WCT Land

  • Would be very much appreciate if you could share your opinions, good or bad, on WCTLAND.

WCT Land is the property arm of WCT Enginerring. It was listed at end 2004 via the reverse takeover of Bescorp Industries.

And under part of the takeover exercise, some loan stocks were issued. ( see this announcement ).

The issue to note is the straight conversion (no cash involved) of 1 loan stock into 2 new ordinary shares upon expiry (do note, there's an option to convert early but the condition isn't as attractive. These loan stocks has a 5-year maturity and expires in 2009. Currently there are 120 million loan stock shares and 321.900 million ordinary shares of WCT Land. And depending on your personal investing strategy, do not discount the dilution effects caused by the loan stocks. Meaning to say, if you are a shorter term investor, then this issue is not going to effect you that much but if you believe that WCT Land has a great prospect in the future and plan to buy and hold for a couple of years, then you should be aware that your earnings could be drastically diluted when these loan stocks are converted into ordinary share.

WCT Land's main development project and its main forte is the BBT project (Bandar Bukit Tinggi) in Klang. The size of this project stated back in 2004 was around 534 ha. As you know, the Bandar Bukit Tinggi is in the Southern Klang region and is now known as the commercial hub of Klang. And for some investors, some might be concerned over this factor, for they view a developer with just one main project as risky and also they might be a bit biased over its future prospect. And perhaps this could be one of the reasons why the performance of the stock is rather lacklusture since its listing.

Which is why the need for this developer to expand beyond BBT. And recently there was an article in the Edge Daily titled: WCT Land's RM196m project in Kota Kinabalu.

This stock is extensively covered by both Affin Securities and Standard and Poors and can be viewed at Bursa eResearch website.

Sunday, May 21, 2006

Local listed companies dabbling in the share market: II

I found this nice little comment on the issue of local listed companies dabbling in the share market!

  • Who care ? It is the other people money & must be fully maximised 2 obtain max. profit. 4 own benefit ????

Well I do care. Other people money? If and when one buys a share of a listed company, they are deemed as shareholders of the company. As a shareholder of the listed company, whose money is it? Is it still OPM (other people's money)??

And for whose benefit? Of course one could argue that the management is doing this for the benefit of the company and the shareholders. But then others could also argue that such practices has no transparency and it leaves the managment the possibility of abusing the company's funds to buy shares in another listed company for personal vested interests or reasoning.

Perhaps let's look at just one company, Pintaras Jaya, who has 'marketable securities' in their balance sheet.

This is a screenshot of Pintaras
earnings notes reported on Feb 2006.


And this is a screenshot of their balance sheet then.


How?

1. Total 'cash' company has = 18.869 + 30.408 + 1.291 = 50.568 mil.
Amount invested in marketable securities = 18.869 mil or 37.3%.

2. Result? Market value = 18.869. Cost of securities = 22.205 million! Ahem!

Pintaras Jaya just announced its latest earnings on 11th May 2006.

This is a screenshot of Pintaras earnings notes.


And this is a screenshot of their balance sheet.


How?

1. Total 'cash' company has = 20.628 + 26.813 + 1.589 = 49.03 mil.
Amount invested in marketable securities = 20.628 mil or 42%!! (hmm.. increased a lot, eh? ).

2. Result? Market value = 20.183. Cost of securities = 22.435 million! Ahem!

How? How does one evaluate Pintaras Jaya's dabbling in the share market? Does Pintaras Jaya's current 'investment result' justify their dabbling in the share market?

And what's the alternative? Hmm.. here's a suggestion. Why couldn't Pintaras Jaya make an effort to return more cash to its shareholders?

Consider this. Pintaras Jaya has been paying a 5% less tax dividends per year, which works to some 2.88 million. Now considering the amount of excess cash utilised by the company in the share market, the dividend payout pales in comparison. So for a minority shareholder in Pintaras Jaya, does the minority shareholder has any grounds of displeasure? Why can't the company pay them more in dividends instead of the company losing money in marketable securities? And worse still, does the minority shareholder know how the money is exactly lost?

Isn't this a justification against listed company dabbling in the share market?

Oh yeah, I forgot. Who cares!

Yeah nothing wrong against your view and opinion since you do not care but for those who does care and wishes not to see their invested money used by these listed company as per their whimps and fancy, perhaps it would not hurt the investors to be very prudent if they see the listed company dabbling in the share market.