Showing posts with label Dow And SPX. Show all posts

Friday, January 07, 2011

Saying Tak Nak!!

On money.cnn:

  • The young and the riskless

    In the wake of the market meltdown of 2008, investors under age 35 are shunning stocks in stunning numbers.

Wednesday, November 24, 2010

Is The Stock Market A Fair Game?

On CNBC:


The clip was highlighted on ZH: Channel Checker Confirms On TV That All Wall Street Does Is Traffic In Borderline (And Often Blatant) Inside Information
  • Channel checking firm Broadband Research CEO John Kunnican was on CNBC earlier and summarized in a few simple sentences the whole topology of precisely how Wall Street works: "It's impossible to be an analyst on Wall Street unless you have an expert network. I know that my contacts at these private companies are having lunch on a regular basis with analysts from Jefferies and Morgan Stanley and Goldman Sachs and what not and I get forwarded the research reports from these banks, and frankly it's a little bit intimidating. I say- geez, i thought i had pretty good contacts but I can't compete." And there you have it - a quid pro quo world, in which inside information (in some case blatant such as when dealing with Phase 1,2,3 trials, or borderline, such as aggregating channel check launch data contemporaneously from all Apple stores) is bartered among the "informational arbitrage" elite on Wall Street, and in which the retail investor has zero chance of competing on a fair basis. And this does not even touch on any of the much more discussed "high barrier to entry" topics such as High Frequency Trading. If after all the disclosures on Zero Hedge over the past two years (which eventually tend to be picked up by the MSM no matter how crazy at first they sound) investors still believe they have a chance to make an honest dollar, when everything is stacked against them, even and especially the regulators, they sure have our blessings and condolences. As for John, good luck finding a new career. Hopefully the clients to whom you showed such exemplary allegiance will put you on their payroll for at least a few months. Furthermore, now that the expert network business model is finally in the open, expect ultra low margin Indian companies to outsource the rolodex offshore, where it is even less regulated, providing their consultants even greater commission, and putting all existing "expert networks" out of a job. That is, of course, unless the SEC, the FBI, or the DA do so first.

Saturday, November 13, 2010

They Said BUY But Then They SOLD!

Saw the following posting at ZH:

  • Guess who, after on September 24 David Tepper almost screamed that he was "balls to the wall long" and EVERYTHING was about to go up on QE2, you were very likely buying shares Bank of America and Citigroup from? Why, David Tepper, that's who. In Tepper's just released Q3 13F, the Appaloosa fund manager disclosed that in the quarter ended September 30, one week after his pompous, self-serving speech on CNBC served as a reason to pump the market up by almost 2%, he sold 18% of his BofA holdings (his largest holding both at June 30 and September 30), 11% of Citi, 19% of Wells Fargo, 19% of Fifth Third, 19% of Capital One, 75% of his then $157 million Hartford Financial position, and lighten up on pretty much all of his other financial positions. And congratulations to CNBC for serving as the medium which David Tepper manipulated to his advantage

Source: David Tepper Dumps 20% Of Financial Holdings During Quarter Of Infamous CNBC Speech

Now who and what does this reminds me of?

Hmmmmmm.......

:P

Tuesday, October 12, 2010

The Funny Rally

Mentioned on cnn.money.

David Joy, chief market strategist with Columbia Management in Boston, agreed. He said it's hard to bet against stocks right now but conceded that the market's recent move is more about waiting for the Fed than any real optimism about the economy

  • "The rally is funny since it's somewhat artificial. Is it driven by solid economic fundamentals showing that things are improving? The answer is clearly no," Joy said. "In the short run you just have to be along for the ride. But for the long run, it makes me a little anxious."

http://money.cnn.com/2010/10/11/markets/thebuzz/index.htm

Friday, October 01, 2010

Wall Street With Funds With Lesser Funds

Yes it's 21 Weeks And 73 Billion Redeemed From Equity Funds and even IBD has started featuring the issue (although on a much watered down version) Stock Fund Outflow Hits $16.53 Billion

  • Posted 09/29/2010 05:44 PM ET

    Investors pulled a net $16.53 billion from stock funds in August as the market fell.

    It was the most since May's $24.76 billion outflow and was up from July's $10.45 billion outflow, according to the Investment Company Institute.

    Indications were that stock fund outflow slowed slightly this month.

    August's outflow was the fourth straight monthly net withdrawal. For the year to date, stock funds gave back $18.19 billion vs. $14.48 billion of inflow in the year-earlier period...

September was a good month, no? Look at CNBC article header: Can Rally Continue After Best September Since 1939?

Best September since 1993 and the stock fund outflow continued!

Yeah.. the inquiry mind wants to know what would be of 'stock funds with much less funds'? And more so, a market with stock funds that has less funds?

How about this from Meredith Whitney who is making a massive prediction that 80,000 layoffs could be seen in Wall Street! ( do play the video)


On the Atlantic.com: Hiring Freezes and Layoffs Begin on Wall Street

The money wasn't flowing as abundantly through Wall Street this summer. Big banks are beginning to slow their hiring and reduce their workforces. And these aren't entirely back- or mid-office jobs, as front-office employees will also be affected. This indicates pessimism on the part of the financial industry, which is likely bad news for the broader economy as well.
Earlier this week, we learned that Morgan Stanley has implemented a hiring freeze on investment banking jobs through the end of 2010. Trading and underwriting have been slow and aren't expected to pick up much in the near-term. Usually, that means layoffs aren't far off.

Indeed, reports also indicate that Bank of America has begun to shed jobs from its capital markets group for the same reason.

A Bloomberg article by Michael J. Moore on the Morgan Stanley freeze says:

  • Companies including Barclays Capital and Credit Suisse Group AG also have started reducing staff in Europe. Securities firms around the world will cut as many as 80,000 jobs in the next 18 months as revenue growth begins to slow, bank analyst Meredith Whitney of Meredith Whitney Advisory Group LLC said in a report dated Aug. 31.

According to a source who spoke with John Carney of CNBC, U.S. fixed income groups will be severely affected. The source describes volume down across the board, predicting a "bloodbath." Part of the problem is new financial regulation, says the source:

  • "It's a one-two blow for fixed income. The derivatives are being commoditized and put on exchanges. Swoosh. Now you don't need half the people you employ to trade and track those. And volume on corporates and agency paper is way down."

Usually when Wall Street firms begin laying off workers, a full-fledged firing wave begins. If volume is down for a few, then it's down for everyone. And for layoffs to ensue, they either overestimated the speed of the recovery or see a double dip. Either way, this is probably bad news for Main Street, since Wall Street firing tends to be a leading indicator for the rest of the labor market.

----- (LOL! Lot's of source too! :P ) -------

And then we have DB Shaw and BoA: DE Shaw, Bank of America (BAC) Layoffs Foreshadow Harsh New Reality for Wall Street

  • Bank of America, according to a person briefed on the decision this morning, is already planning to eliminate up to 30 proprietary trading jobs, or almost one-third of its proprietary trading division. JPMorgan has revealed plans to move proprietary traders into its Asset Management division in order to salvage some of their prop trading desks, reported the New York Times on Monday. Goldman Sachs will reportedly dissolve or spin off its proprietary trading teams entirely. Credit Suisse recently forked $425 million for a stake in Swiss bank York Capital (a deal that is compliant with the Volcker Rule, which allows banks to own hedge fund managers while limiting the investment of the bank capital in funds itself). Despite strategies to deal with the impending regulations, these firms have already seen an exodus of talent to private equity firms and hedge funds, such as Blackstone. But many think that when the dust settles, not every cute puppy will be able to find a new home.
  • THE CASE OF DE SHAW
    Following $7 billion in redemptions in the past few months, esteemed quant hedge fund DE Shaw is cutting 10% of its work force, which, in this case, represents 150 of the brightest math geniuses around. Many have purported that job cuts in the financial services industry would be mainly limited to secretaries and back room staff, but these across the board cuts include partners and portfolio managers as part of a long term strategic review by the company. The decision was clearly not taken lightly, which makes it that much more telling. Perhaps (gasp!) the opportunities for quantitative exploitation of our financial markets are reaching a head, or is becoming saturated to the point that further expansion in that space is darn near impossible.Although slightly off topic, it is interesting to consider the possible implications of DE Shaw’s massive redemptions, per ZeroHedge. Given the rally in equities over the past few months, it is also fair to presume many of DE Shaw’s losing positions were bearish ones, and the unwinding of those positions contributed, at least in part, to the acceleration of the rally. Many market participants have been left wondering, "who continues to buy this stuff?" Now, we have an example of at least on type of example. Hedge Fund titans like David Tepper of Appaloosa and Bill Gross are mindful that you must always be mindful of the Fed, and the implications of its actions, when developing a core investment strategy, but the recent the recent ramp up in equities (to the detriment of quant funds like DE Shaw) shows the dangers in setting such a precedent for market manipulation by our great central bank. It seems that is the current environment, the only way to deliver consistent returns is by essentially front-running the Fed.

The DE Shaw is the most interesting.

7 Billion Redeemptions and 10 percent layoffs ( they laid off their math geniuses!)!!!

Ah.. perhaps they (DE Shaw) deserved it for doing what they did - do see this article A poster child for treating investors poorly?

On NY Times Blog: Wall Street's Layoff Problem Is Spreading‎

  • And Morgan Stanley is taking a related approach: it’s asking bosses to hold off on new hires unless the position absolutely needs to be filled.
    As Nelson D. Schwartz pointed out in The New York Times last week:
    After an unusually sharp slowdown in trading this summer, analysts are rethinking their profit forecasts for 2010. …
    While the numbers will not be known until after the third quarter ends and financial companies begin reporting earnings in October, the pace of trading this summer was slow even by normal summer standards. Trading in shares listed on the New York Stock Exchange was down by 11 percent in July from 2009 levels, and August volume was off nearly 30 percent.

Ahem!

Note the very last sentence: trading in shares listed on the New York Stock Exchange was down by 11 percent in July from 2009 levels, and August volume was off nearly 30 percent.

Monday, September 27, 2010

According To ZH: Further Confirmation On The Irrelevance Of Stock Markets

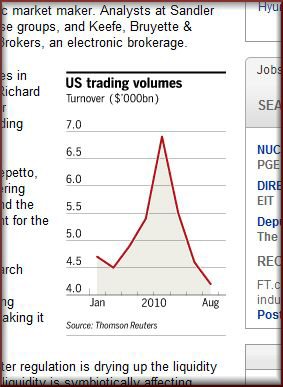
The following was posted on ZH: ( I love the trading volume chart highlighted in the posting from FT.com)


--------------------------------
Further Confirmation On The Irrelevance Of Stock Markets


Last week we pointed out that Jefferies group, one of the last few remaining non-BHC broker-dealers, has just experienced its single most disastrous drop in trading volumes, as its principal trading revenues plunged by 80% QoQ. This is merely confirmation of what we have been warning ever since we started highlighting the series of 20 consecutive outflows from domestic equity funds: banks will soon be forced to lay off thousands of people as the primary revenue driver for the bulk of Wall Street firms - stock volumes - is now gone. BofA and RBS have already confirmed they are letting people go. Next up: the electronic trading giants such as ITG, Knight and Schwab. And it will only get worse. As the FT reports, September trading volumes are already 8% below August's, which in turn was the lowest in 3 years! Of course, the Fed is fully confident that if the DJIA ends September at 11,000, investor confidence in stocks will return. We have one word for that - LOL.

From FT:

  • The continuing decrease in volume reported by the US’s largest electronic trading groups has triggered a fear among analysts that the fall in market activity might be more than a seasonal phenomenon.

    Trading-focused groups such as ITG, Knight Capital and Charles Schwab enjoyed upbeat second quarters when the European debt crisis sparked extreme volatility. As fear has given way to unease with the global economy, however, trading volumes have fallen sharply.

    “You’re starting to see some real pain,” said Christopher Allen, an analyst at Ticonderoga Securities. “September is not a material improvement over August. Aside from possibly the US election, I’m not sure what the catalyst is for trading.” A record-long streak of outflows from equity mutual funds – now 20 successive weeks beginning in May, according to the Investment Company Institute – and reluctance by even normally bold hedge fund managers to take big bets has suggested that there are more than seasonal factors at work.

    Mr Allen’s figures, compiled last week, show that trades for the trading industry are down 8 per cent so far in September from August, when trading fell to a three-year low.

And what is funniest is that the decline in volume is blamed on the (lack of) intervention in the HFT's daily attempts to pickpocket slow money institutions

  • Diego Perfumo, an analyst at Equity Research Desk, said that efforts by global regulators following the May “flash crash” were reducing volumes by high-speed firms, which was making it more difficult for other investors to trade.“Higher trading scrutiny combined with tighter regulation is drying up the liquidity provided by high- frequency traders. Lower liquidity is symbiotically affecting volumes from traditional investors,” he said

Oh really? Has anybody been affected by the "decline" in liquidity in SPY, Amazon or Apple? Last time we checked the only three products that trade had no problem with hitting bids (of course, front run several trillion times by $0.0001 bids just ahead of the submitted one to get the price high enough so that the last HFT bagholder can offload to you). Instead of lying, perhaps Diego and his firm, which incidentally makes money from the status quo and sees to lose millions should HFT scalping be impaired, as it seems the firm provides "Execution services from ITG, Credit Suisse, BNY and Instinet", but oddly enough the FT did not feel relevant to disclose this blatant conflict of interest, should look at the primary cause for volume collapse: that confidence in stock markets is gone, period. Nobody dares to hold stocks overnight, as nobody still has any clue why the market crashes 1,000 point in the span of a few seconds. If anyone hopes to revive faith in the stock market without someone getting punishment for the most ridiculous market crash since October 1987, they have another thing coming.

Wall Street may have gotten off scott free from the greatest absolute household wealth destruction episode in history, but when it comes to capital formation, pretty much everyone save for a few vacuum tubes, have had enough. And luckily, that means that worthless HFT, and other high volume parasite traders, will soon be out of a job. No tears will be shed as equilibrium reestablishes itself, and those providing absolutely no value to the stock market will become extinct. If the market will not self-correct, the market will be forced to self-correct.

------------------------------------------

ahem...

  • A record-long streak of outflows from equity mutual funds – now 20 successive weeks beginning in May, according to the Investment Company Institute – and reluctance by even normally bold hedge fund managers to take big bets has suggested that there are more than seasonal factors at work.

Even FT.com highlights this issue.

LOL!

Reply From Kokanart: Time To Highlight The Other Side Of Your Obsessive Focus

:-)

yeah: 20 Consecutive Weeks Of Fund Outflows And 71 Billion Withdrawn From Equity Funds

Wednesday, September 15, 2010

They Just Don't Trust Wall Street

On CNBC 'Flash Crash' Effect: Investors Don't Trust Wall Street


  • Nearly five months after the May 6 Flash Crash, many individual investors see the stock market as rigged, and they have little confidence in regulators to fix it.

    Most of the poll's 1,035 respondents view the market as unfair to small investors.
    In a new CNBC/Associated Press poll, 86 percent of the 1,035 respondents view the market as unfair to small investors..... ( more here )

Does it show?

Could this be the very reason that 65 Billion Outflow From Long Term Equity Funds?

Then I saw the following article on ZH: Another Day, Another Flash Crash

  • It has been about a week since we have had a flash crash in our broken markets, and we were getting a little antsy. Then Nucor showed up and traded at $0.01. At 11:52:21 something broke, and as the QR chart below shows, it was basically precisely the same algo malfunction that either goes and hits all bids all the way to zero, or some HFT decided to shut down, and wipe out the entire bidside orderbook. The stock which had been trading at $39.58 literally milliseconds earlier, saw a SkyNet T-1 unit go berserk and take out the bids at $37.22, and $35.77 in sequential fashion, with the next trade being at at the residual stub quote of $0.01. Of course, circuit breakers were triggered, but not before even more irreversible damage to investor confidence was suffered. And those idiots 'upstairs' still wonder why tomorrow we will report another massive outflow from mutual funds.


    There is a pattern emerging: every week we are seeing a flash crash in more and more prominent stocks. These are getting more and more frequent. And instead of fixing the underlying cause, the SEC continues to fret with reactive damage control, and DKing trades of those who are brave enough to step in and take advantage of broken algos. How long will this kindof bullshit travesty continue?

A stock that was trading at $39.58 hit $0.01 milliseconds later?

LOL!

The machines... the machines... the machines... the machines did it!

Saturday, September 04, 2010

Market Soars But 'They' Are Still On Vacation!

And the markets they rallied again and the best one line from CNN Market Wrap article, Dow back in the black for 2010

  • Trading volume was light with many market participants on vacation.

That just says it all.

The excuse that the trading volume was light or non-existent or DEAD was many market participants are on vacation.

Glee!

Still on vacation?

Doesn't that line wears awfully thin?

Just how long have they been on vacation? Since 28th April 2010? ( *winks* )

How about they tell the fact that too little money had been withdrawn from the equity mutual funds? When these fund have no money, how does one expect to see volume in the markets? ( See 58 Billion Reason Why Americans Thinks Their Stock Market Sucks! )

On vacation? LOL!

ps: Houston, We Have No Problem... Or Volume and Can You Hear Me Now? 17th Weekly Fund Outflow As Equity Fund Redemptions Accelerate

Thursday, September 02, 2010

58 Billion Reason Why Americans Thinks Their Stock Market Sucks!

Nah.. it's not breaking news no more. Some aren't even interested in this anymore.

But.... for those who are still interested... here's the weekly update!


Americans have taken out some 4.313 Billion from the equity markets!

Here's my table keeping track of what's happening...


And yes... some 58 (57.7) Billion USD have caught the last train for the coast... the day the music ....

And if you have been counting, that's seventeen consecutive weeks that Americans have pulled out money from long term equity funds.

Seventeen yo!

And 57.7 BILLION bucks!

Yessirme!

Them Americans simply don't care! Their equity market could be flying or it could be plunging. All they want to do is they just want out!

Yeah.. value is not required! Neither is stock charts.


But for the fun of it....

DJIA


Nasdaq


S&P


The 'GREEN ZONE' shown in the charts above, indicates this seventeen weeks when Americans have pulled some 58 Billion out of their equity markets!

Yeah.. in regardless if their markets is UP or DOWN... they just WANT OUT!

ps: how ironic... some markets rally because of the US markets. :P

Thursday, August 26, 2010

Americans Pulled USD 53.279 Billion Out Of The Equity Markets

Posted recently:


  1. Main Street Telling Wall Street That The Equity Markets Stinks!
  2. Stocks Rally And US Equity Investors Rallied To Get Out Of the Equity Markets

This issue was actually highlighted on the NY Times on 21st Aug 2010. ( :P )

In Striking Shift, Small Investors Flee Stock Market

A short passage from that article.

  • ..... Small investors are “losing their appetite for risk,” a Credit Suisse analyst, Doug Cliggott, said in a report to investors on Friday.

    One of the phenomena of the last several decades has been the rise of the individual investor. As Americans have become more responsible for their own retirement, they have poured money into stocks with such faith that half of the country’s households now own shares directly or through mutual funds, which are by far the most popular way Americans invest in stocks. So the turnabout is striking.

    So is the timing. After past recessions, ordinary investors have typically regained their enthusiasm for stocks, hoping to profit as the economy recovered. This time, even as corporate earnings have improved, Americans have become more guarded with their investments.

    “At this stage in the economic cycle, $10 to $20 billion would normally be flowing into domestic equity funds” rather than the billions that are flowing out, said Brian K. Reid, chief economist of the investment institute. He added, “This is very unusual.”

    The notion that stocks tend to be safe and profitable investments over time seems to have been dented in much the same way that a decline in home values and in job stability the last few years has altered Americans’ sense of financial security.

    It may take many years before it is clear whether this becomes a long-term shift in psychology. After technology and dot-com shares crashed in the early 2000s, for example, investors were quick to re-enter the stock market. Yet bigger economic calamities like the Great Depression affected people’s attitudes toward money for decades.

    For now, though, mixed economic data is presenting a picture of an economy that is recovering feebly from recession.

    “For a lot of ordinary people, the economic recovery does not feel real,” said Loren Fox, a senior analyst at Strategic Insight, a New York research and data firm. “People are not going to rush toward the stock market on a sustained basis until they feel more confident of employment growth and the sustainability of the economic recovery.”

LOL! The economic recovery does not feel real. What an under statement. :P

ps: saw this on MSNBC: Regardless of numbers, it feels like a recession

Anyway here's the weekly update and as expected, more money is taken out of the equity markets!


And the money taken out since 28th April 2010 is really, really staggering!


Yes, some USD53.279 BILLION has been taken out from long term equity mutual funds!

USD 53.279 Billion yo!

That's 16th consecutive weeks of outflows!

Heck, the Americans do not care if their equity market is raising or sinking, they just want out! (Yeah.. stock chart not required! :P )

Yes, Main Street is telling Wall Street that their equity markets sucks!

They want out!

And Wall Street better start worrying. As stated before investment bankers are seeing layoffs! ( see Barclays Layoffs: The First of Many Axes to Fall?, then Credit Suisse Follows Barclays in Layoffs. )

This is not a shocker. If their customers continues to withdraw at this place, for whom does the investment banker work for?

And here's one interesting posting: If Wall Street Starts Layoffs, Everyone Should Worry

Thursday, August 12, 2010

Main Street Telling Wall Street That The Equity Markets Stinks!

As expected, more money is pulled out from the equity markets.

  • Equity funds had estimated outflows of $2.87 billion for the week, compared to estimated outflows of $4.08 billion in the previous week. Domestic equity funds had estimated outflows of $2.79 billion, while estimated outflows from foreign equity funds were $82 million.

There you go! The only conclusion I can get from these actions is that Main Street USA is telling that the equity markets stinks!!!

And I have the USD 49.126 Billion proof to back the above statement!!!

From 28th April 2010 to 4th August 2010, Main Street USA had pulled out 'a mere' USD 49.126 Billion out from the equities market!!!

And if you are counting, that's ONLY 14 weeks in a row that Main Street USA is taking money from their equity markets!

Tell me if USD 49.126 is some small change!!!

So pardon my flawed interpretation but this suggests to me strongly that Main Street USA is telling Wall Street that their equity markets stinks!!!!

Yes, in fact, stinks to hell hell!

They just don't trust the equity markets anymore!

Remember the AIG bailout fiasco? The laughing stock of the entire century?

Here's an excellent posting from Jesse: Why The Bankers, The Fed, and Their Allies In Washington Are Afraid of Elizabeth Warren . It highlights the The AIG Bailout Scandal: Bailing out AIG effectively meant rescuing Goldman Sachs, Morgan Stanley, Bank of America and Merrill Lynch (as well as a dozens of European banks) from huge losses. Those financial institutions played the derivatives game with AIG, the esoteric practice of placing financial bets on future events. AIG lost its bets, which led to its collapse. But other gamblers—the counterparties in AIG’s derivative deals—were made whole on their bets, paid off 100 cents on the dollar. Taxpayers got stuck with the bill!

Last night the US markets fell and surprise, surprise the volume increases!

LOL! Up on wafer thin volumes and down on increased volumes. I wonder what does this suggest?

Now with so all these money pulling out from the equity markets, who do you think is hurting?

The following article is from WSJ: Barclays Layoffs: The First of Many Axes to Fall?

  • By Michael Corkery
    Don’t worry. It is just a few hundred support staff in the sales and trading unit, right?

    Barclays Capital, the investment-banking unit of the U.K.’s Barclays PLC, plans to lay off hundreds of employees.
    While it is mostly to affect back-office operations, the move no doubt is causing at least a few upset stomachs across Wall Street.

    That is because Wall Street just experienced a dismal second quarter for trading....

Yeah.. a dismal second quarter for trading! How can they make money when there is no customers to trade/invest for?

Would you expect many axes to fall?

Well at the rate of how much money is pulled OUT from the equity markets, I won't be surprised at all!

Thursday, August 05, 2010

Stocks Are Flying To The Orbit But Investors Keeps Cashing Out!

The markets keep telling you that the stocks are going higher and higher.

Stocks are simpling flying into the orbit...

The technicians are going berserk!


S&P is trading above the 200 MA, the lows are highers, the highs are highers.... all system go, right Houston?

And despite all the constant bad news, the market still continues to trend higher.

This is great or what!

But................................................

here's an update to the posting Since 28th April 2010, Americans Pulled USD 42.116 Billion Out From Equities!

In today's ici filings:

  • Equity funds had estimated outflows of $3.85 billion for the week, compared to estimated outflows of $1.32 billion in the previous week. Domestic equity funds had estimated outflows of $4.10 billion, while estimated inflows to foreign equity funds were $255 million.


WOW!

Domestic equity funds had estimated outflows of $4.10 billion???

huhu!

Now if I update my compiled table, this is what I am starring at.


So from 28th April 2010 to 28th July 2010, domestic (Americans) have pulled out a mere US 47.025 Billion out from the equities market!


47.025 Billion out in exactly 3 months!

That's ONLY 15.675 Billion taken out from the US equity markets!

How?

How do you really want to interpret this?

Americans simply don't like their stock markets no more?

Or do Americans know something we don't know?

How?

Do you like how the US stock market is melting upwards?

Or as long as the market is UP or Green, everything else matters not?

Yeah.. the market is on a BULL RUN! I simply need to STFU!

:D

Friday, July 30, 2010

Since 28th April 2010, Americans Pulled USD 42.116 Billion Out From Equities!

So how has the S&P performed for the current month of July?


Now that's rather impressive right? (except for the lack of volume :P )

Now I have been posting recently on out from US Equities. :P

July 9th: And The Stock Markets Rallied... Because Of....

  • Equity funds had estimated outflows of $180 million for the week, compared to estimated outflows of $1.28 billion in the previous week. Domestic equity funds had estimated outflows of $227 million, while estimated inflows to foreign equity funds were $47 million.

July 16th: The Markets And Fund Flows

  • Equity funds had estimated outflows of $4.23 billion for the week, compared to estimated outflows of $216 million in the previous week. Domestic equity funds had estimated outflows of $4.12 billion, while estimated outflows from foreign equity funds were $112 million.

July 22nd: And The Money Keeps Flowing Out From US Equities

  • Equity funds had estimated outflows of $3.27 billion for the week, compared to estimated outflows of $4.29 billion in the previous week. Domestic equity funds had estimated outflows of $3.16 billion, while estimated outflows from foreign equity funds were $113 million.

Now surely... the Amercians can see that the S&P is going up higher and higher yes?

And despite the markets going up higher, they continued to take out money from the US equities!

Wassap?

Is there a plague with the US equities?

And here's the latest update, for the period ending 21 July 2010:

  • Equity funds had estimated outflows of $1.32 billion for the week, compared to estimated outflows of $3.19 billion in the previous week. Domestic equity funds had estimated outflows of $1.53 billion, while estimated inflows to foreign equity funds were $204 million.

Now if I compile the recent data...


Now don't let me scare you but let's have a rational look at the data itself. (data source: here )

Well the week prior to 5th May was 28th April and since 28th April 2010, Americans took out a whopping 42.116 Billion out from the US Equities!

Why?

No more love for the US Equities markets?

I dunno....

ps... at this rate... it's no wonder... in regards the lack of volume in the market. LOL!

Tuesday, July 27, 2010

And The Spin On New Home Sales Sends Stocks To The Moon

As expected the markets rallied.

A rise in new home sales?

Wiki Wiki!

The US Census report: http://www.census.gov/const/newressales.pdf

  • Sales of new single-family houses in June 2010 were at a seasonally adjusted annual rate of 330,000, according to estimates released jointly today by the U.S. Census Bureau and the Department of Housing and Urban Development.
    This is 23.6 percent (±15.3%) above the revised May rate of 267,000, but is 16.7 percent (±10.9%) below the June 2009 estimate of 396,000.

So it's a 23.6% improvement...and here is CNBC market wrap notes: Stock Gains Top 1%; FedEx, Builders Lead (ps: 'revised' )

  • Stocks posted an impressive late-day rally boosted by positive sentiment over improvement in new home sales and strong earnings reports.
    Though the summer trend of anemic market volume continued, Wall Street churned out yet another impressive day that sent the Dow positive for the year and the Standard & Poor's 500 to a critical close above its 200-day moving average.

LOL! Anemic volume :P Glee! Well if Americans are taking money out of equities, surely we won't see any improvement on the non-existing volume in the equity markets.

  • So short-covering or not, traders were more than happy to accept another strong trading day that has the market on the path for its best month in a year.
    "Volume is still horrible, but I think we've got to get used to this. This is what you call the 'new normal,'" said Dave Rovelli, managing director of US equity trading at Canaccord Adams. "So now it would be nice to see some fund inflows, from bond funds to stock funds."

:D

  • The other major piece of news for the day saw new housing sales rise 23.6 percent in June and inventory hit a 42-year low.
    Analysts had worried that the stockpiling of houses on the market would keep prices depressed and hold down the market.

Ahem... see how nicely they have forgotten to stress on the word 'revised'?

Now if we click on CNBC link: new housing sales rise 23.6 percent

  • Sales of new U.S. single-family homes rebounded strongly in June from the prior month's record low, driving the number of houses on the market to its lowest level in nearly 42 years.

Rebounded strongly????? LOL!

  • The Commerce Department said on Monday sales jumped 23.6 percent to a 330,000 unit annual rate from a downwardly revised 267,000 units in May. The sales pace last month was still the second lowest since records started in 1963. The percentage increase was the largest increase since May 1980, and partially unwound the prior month's historic 36.7 percent decline.

May home sales were revised DOWN just to 267,000. LOL! No wonder this 330,000 looks so impressive. (ps: The sales pace last month was still the second lowest since records started in 1963. )

And of course folks like TD easily spotted it and had no kind words for the headline spinning!

  • So June new home sales come in at 330,000 on expectations of 310,000: a decent beat by 20k or so, and a "record" increase from the May revised 267k. However, this "beat", and massive 23.6% MoM surge only occurred due to prior downward (of course) revision which took away 57k from the past two months! The May number was revised down from 300k, or by 33k, to the lowest sales number on record of 267k. And April, not to be undone, two months after the initial release, has received its second downward adjustment, this time down by 24k from 446k to 422k. So let's get this straight: this was the worst June on record, following the worst month on record in new home sales ever, the beat was completely drowned out by 57k worth of prior revisions, the average new home price slid another 1.4% to $213,400, yet just because the new home supply is down to "just" 7.6 month from 9.6 in May it is enough to push stocks to the moon (of course this completely ignores that existing homes sales are back to 9 months, and shadow inventory is more than double that. Who cares - machine language does not add, it only multiples). Another day, another insane day in stocks, which are now programmed to ignore reality, and just focus on the propaganda headline spin. ( Atrocious New Homes Sales Data Sufficient To Force Another Algo Mediated Short Covering Frenzy )

LOL! Yessir me and the cow did jumped over the moon. :P

On Calculated Risk: New Home Sales: Worst June on Record

  • Ignore all the month to previous month comparisons. May was revised down sharply and that makes the increase look significant. Here is the bottom line: this was the worst June for new home sales on record.

Here's the chart of the New Home Sales (source: New Home Sales Bounce Off Their Revised May Low )

And so the US markets is rallying because of the new home sales???

LOL! LOL! LOL!

:D

Yup... it all doesn't matter... doesn't it.

Like the old man told Paul ..


Saturday, July 17, 2010

S&P Fell 2.88% On Much Higher Volume

The S&P lost some 31 pts or 2.88% yesterday.


The volume issue again stood out.

I would like to update the figures posted in the posting: Market Goes Up Again Despite The Lack Of Interest

1. The Flash Crash happened on 6 May 2010. Volume on that day is 10,617,809,600.

2. Average traded volume for 2010 is 5,068,325,849. ( data source:
here )

3. The recent closing and traded volume..


The bigger down days were marked with pink.

What do you see? What I do see? Well, my eyes might be flawed but I can see on these pink days, the volumes are much higher. And when the market goes up, it goes up on small volume and more interesting is the fact that the average traded volume this year is 5,068,325,849 and if you look at current July data, every time the SP goes up, the volume is significantly lower than the average traded volume. And when it goes down, the big volume appears again.

Push up on light volume so that can sell on heavier volume... and repeat... and repeat... and repeat?

ps: The Baltic did not fall yesterday! :D

Friday, July 16, 2010

The Markets And Fund Flows

Let's see...

On the 2nd July SP500 was at 1022.58.
Last night, on the 15th July, SP500 closed at 1096.48.

Impressive?

The index went up, up and away. Soared like an eagle. :D

Yeah the low volume or the lack of interest is noted in the equities is noted.

Maybe them small investors know nuts. Maybe they are in a panic mode.

But panic mode when the market goes up?

Hmmm..... would this make sense?

Let's check out the fund flows, ie, are the Americans putting more money in this latest run?

Before I check, the 'older' recent postings on fund flows have been noted in the following postings..


  • Equity funds had estimated outflows of $4.23 billion for the week, compared to estimated outflows of $216 million in the previous week. Domestic equity funds had estimated outflows of $4.12 billion, while estimated outflows from foreign equity funds were $112 million.

From the data, Americans pulled out some 4.23 billion from equities for the period ending 7th July!

That was the week, the US markets flew up, up and away!

And as you can see from the table, this week was the highest outflow week, compared to the previous four weeks.

Hmmm.... pulling money out of the long term funds when the market is going up????

Maybe they are silly.... but .... what if they aren't?

Tuesday, July 13, 2010

Why Small Investors Have No Interest In Equities

Recent postings;

On WSJ: Small Investors Flee Stocks, Changing Market Dynamics

  • By E.S. BROWNING
    Many individual investors were tiptoeing back into stocks in the spring. Now, they're running for cover again.

    Karen and Roger Potyk, a comfortably retired couple in San Antonio, Tex., had clung to some stock mutual funds despite their anxiety following the financial crisis of 2008. But the renewed market volatility following the "flash crash" of May 6 proved too much to bear.

    We just didn't want to put up with it any more," says Karen Potyk. She and her husband sold the last of their stock holdings on May 20, moving the money to bonds, certificates of deposit and bond-like annuities.

    Small investors' faith in stocks, which surged in the 1990s, has collapsed since the technology-stock debacle and the Enron and WorldCom scandals of 2000-2002. The 2007-2009 financial crisis only made things worse. Now, the pullback among ordinary investors means they are a declining force in a market that is increasingly dominated by professionals.

    Some were tantalized by equities during the 70% rally that began in March 2009 and ran through April. But mutual-fund data and other clues suggest that that brief infatuation has ended.

    In 2002, investors withdrew more money from mutual funds that invest in U.S. stocks than they put in. Then from 2007 through 2009 they withdrew money for three consecutive years. That marked the first three-year period of withdrawals since 1979-1981, according to the Investment Company Institute, a mutual-fund trade group. This year, U.S.-stock funds saw inflows in January, March and April, but net withdrawals resumed in May.

    Investors talk of a growing disillusionment with big institutions, including corporations, government, banks and political parties—as well as fears about the nation's heavy debt. Some people's confidence in stocks was seriously shaken by the volatility that returned in May. They worry that the May 6 flash crash, when the Dow Jones Industrial Average fell 700 points in eight minutes before rebounding, is a sign that ordinary people are increasingly at the mercy of anonymous companies that trade with powerful computers.

    Individual investors were important market pillars in the 1990s, but their flight from stocks is changing the market dynamic. By adding money to mutual funds, individuals helped push stocks higher in the 1990s and to a lesser extent from 2003 through 2006. Now they are moving money out again on balance, making them a drag on the market.

    Ordinary investors are returning to the cautious mentality they developed during the 1970s. That was the last extended period of stock weakness, after which it took many people a decade or more to get comfortable with stocks again.

    "I feel like the tail of the dog that is being wagged by institutional investors who are taking a lot of risk, playing a lot of games and just have these computerized orders that affect me a lot," says Simeon Thibeaux, a semi-retired businessman from Alexandria, La.

    History suggests that individuals eventually will return to stocks, as they did in the 1980s and, even more strongly, in the 1990s. But rebuilding their confidence could take time, says Brian Reid, chief economist of the Investment Company Institute. Historically, it has taken an extended period of stock success to lure individuals back after long periods of disaffection.

    Rebounding after a two-month slump, the Dow Jones Industrial Average jumped 511 points, or 5%, to 10198.03 last week, its biggest weekly gain in almost a year, although it remains down 9% since topping out on April 26.

    "We have gone through two of the worst bear markets since the Great Depression, and it has given investors a better sense of the risks and dangers of investing" in stocks, Mr. Reid says, referring to the bear markets of 2000-2002 and 2007-2009.

    The gradual dissipation of investor confidence can be seen in mutual-fund investing patterns.

    After getting hurt in the 2000 tech-stock crunch, individuals came back to U.S.-stock funds in 2003, as stocks were entering a new bull market, ICI data show. But the buying proved tepid and turned to net selling in the latter part of 2006, even before the bull market ended in 2007. Despite occasional periods of inflows to U.S.-stock funds, the selling trend has continued since then. Individuals removed a net $7 billion from stock funds in the seven days ending May 12 and $13 billion two weeks later, eclipsing the deposits from earlier in the year.

    Recent volatility has certainly shaken the Potyks' confidence. Mr. Potyk, a 68-year-old pharmacist, spent 25 years as an army officer and 11 years with Pfizer before retiring. His wife, 63, is a retired real-estate broker.

    The Potyks stuck with their stocks through the tech wreck, the Sept. 11 attacks and Enron. They were willing to take risks to get stock-market returns. By 2006, he and his financial adviser say, the Potyks' portfolio was 50% stocks and 50% bonds and other fixed-income investments.

    The big blow to their confidence was the 2008 collapse of brokerage-firm Lehman Brothers, in which they lost $75,000 on a Lehman bond. Although it was a bond that hurt them, the Potyks' faith in all potentially risky investments was shattered.

    "In the military, you learn that you want people you can respect, trust—who have integrity," Mr. Potyk says. "Over the last five years or so, I find that our financial institutions have no shred of the character I describe."

    The last straw was the May market volatility, accompanied by widespread fears about European government debt. On May 20, the Potyks asked their financial adviser to sell the last of their stock mutual funds.

    Now that their portfolio consists entirely of fixed-income investments, "I won't make 8% on my money. I will make 4% or 5%, but the money will be there," says Mr. Potyk.

    Stocks had developed an almost cult-like following in the 1980s and 1990s, when they were among the best investments available. But in the past decade, big U.S. stocks have had the worst performance of nine major investment classes tracked by investment research firm Morningstar.

    The Standard & Poor's 500 stock index has fallen at an annualized rate of 3% a year over the past 10 years, including dividends and controlling for inflation. Long-term Treasury bonds show a gain of 5% a year during that same period, after inflation. Gold is up 10% a year and real-estate investment trusts 8% a year. The S&P 500 index itself, without adjusting for inflation and dividends, is stuck today at a level it first reached 12 years ago, meaning it has gone nowhere in more than a decade, scaring a legion of people in the process.

    Reflecting their flight from risk, individual investors appear to be losing faith in an investment strategy called buying on the dips. In times of stock strength, people learn to buy stocks after a decline, when they are cheaper, because the stocks have a tendency to recover. Lately, investors have been reversing that behavior, selling on dips for fear the declines will continue.

    The Yale School of Management maintains an index, designed by Professor Robert Shiller, that tracks individuals' willingness to buy on dips, based on a monthly survey of wealthy investors. The index topped out in 2002. While it has moved up and down since then, it has been falling since the start of 2009.

    Some investors, haunted by the continuing credit crunch and unemployment fears, are being driven to pull money out of stock funds to make up budget shortfalls.

    Also eating away at risk tolerance is demographics: Baby boomers are aging, making them think more about preserving their holdings' value. This is only part of the story, however: The Investment Company Institute data show lower risk tolerance among younger people, too.

    In surveys of mutual-fund owners, the ICI found that just 30% said in 2009 that they were willing to take above-average or substantial risk in the stock market, down from 37% in 2008. The number willing to take only below-average risk or no risk at all rose to 20% from 14%.

    Mr. Thibeaux of Alexandria, La., sold one-third of his stock mutual funds late in April at the suggestion of an investment adviser, who warned him that stocks were due for a pullback.

    The problem was where to put the cash. A money-market fund at his mutual-fund company or a short-term certificate of deposit at his bank would yield almost nothing, he says. He finally decided simply to pay off the mortgage on a second home, on which he was paying 5% interest.

    "I think there is no investment strategy now except to buckle up and hope that you don't get hit too hard," Mr. Thibeaux says.

    Long-term investors have been showing a distinct change in behavior since 2008. Jay Pestrichelli, who monitors client behavior at online brokerage firm TD Ameritrade, has noted a change in the traditional buy and hold strategy. "People who once made few changes to their accounts have begun trading more frequently," he says. He saw the trend especially clearly on May 6, when there was an uptick of selling.

    "A higher percentage of our trading was coming from our longer-term investor base," he says. People who might log into their accounts regularly, but not necessarily trade, were selling heavily that day, he says.

    "The next day, those clients were all buying back in," he says, often losing money on a trade where they had sold low and bought higher. "To see that kind of a move in such a short period of time, it certainly can shake their trust."

    James Rotenstreich, a businessman in Birmingham, Ala., says the May flash crash damaged his confidence in stocks as a store of wealth.

    "I was just dumbfounded. The whole thing could have melted down, and I wouldn't have had much to do with it one way or the other," he says.

    Mr. Rotenstreich has received offers for some real estate he owns in the Birmingham area, but so far has been reluctant to sell, he says, in part because he doesn't know what he would do with the money. He notes that corporate bonds and other alternatives also suffered severely in the market decline.

    Reflecting on his options, he says that if he sold the real estate, "I really think I would put it in the bond market. So maybe I have lost some faith in the future of the stock market."

    Some investment advisers are telling clients that, for long-term investors, this summer will turn out to have been a great time to buy stocks on the cheap. So far, not many clients are listening.

ps: Yesterday volume for SP500 was 2,936,043,264. Let's see the action tonite. :D

Market Goes Up Again Despite The Lack Of Interest

The US Markets went up again. :D


Look at the volume... 2,936,043,264!

Let's repeat what was highlighted as per weekend's posting Lack Of Interest In US Equities

1. The Flash Crash happened on 6 May 2010. Volume on that day is 10,617,809,600.

2. Average traded volume for 2010 is 5,090,658,997.

3. The recent traded volume..

9-Jul-10 ... 3,506,570,000
8-Jul-10 ... 4,548,460,000
7-Jul-10 ... 4,931,220,000
6-Jul-10 ... 4,691,240,000
2-Jul-10 ... 3,968,500,000

Yesterday or 12-Jul-10 traded volume 2,936,043,264!!!!

More lack of interest?

Sunday, July 11, 2010

Lack Of Interest In US Equities

Chart of SP500.


Sometimes numbers are more 'telling'.

1. The Flash Crash happened on 6 May 2010. Volume on that day is 10,617,809,600.

2. Average traded volume for 2010 is 5,090,658,997.

3. The recent traded volume..

9-Jul-10 ... 3,506,570,000
8-Jul-10 ... 4,548,460,000
7-Jul-10 ... 4,931,220,000
6-Jul-10 ... 4,691,240,000
2-Jul-10 ... 3,968,500,000

Again the volume shows utter lack of interest in the equities.


Friday, July 09, 2010

And The Stock Markets Rallied... Because Of....

Oh yeah. Another triple digit advance for the Dow. :D

Time to check out them news to see wassap! :D

Wall Street up for third day on data and retail sales

  • NEW YORK: Wall Street rose for a third straight day on Thursday, July 8 as investors were encouraged to see jobless claims fall and a handful of large retailers report solid sales.

1. Encouraged to see jobless claims fall. (?? LOL! )

Now on the DOL (Department of Labour) website:


SA stands for Seasonally Adjusted data and the NSA stands for Not Seasonally Adjusted Data. So the adjusted data showed a drop of 21k claims but the unadjusted data showed an increase of 22.5k. (
What is the difference between seasonally adjusted and non-seasonally adjusted data? )

And here is the chart of the Seasonally Adjusted Jobless Claims.


Source: Bureau of Labor Statistics

Are those jobless claim numbers so hot that it created such optimism in the market? I wonder. (ps: I wonder if I should be even focused on jobless claims in the first place! )

Ok, assume I am wrong and that the market is correct. :D

I will then ask if the optimism is shared by actual market demand. Am I seeing more demand in stocks? Time to look at the charts and see what the volume is saying again.


Do I see increase in volume? Or did the volume actually shrank compared to to yesterday?

Going up on shrinking volume?

And what about the money outflows from long term mutual funds? (Yeah, see last month's posting: Of Low Volumes And Fund Outflows From Long Term Mutual Funds )
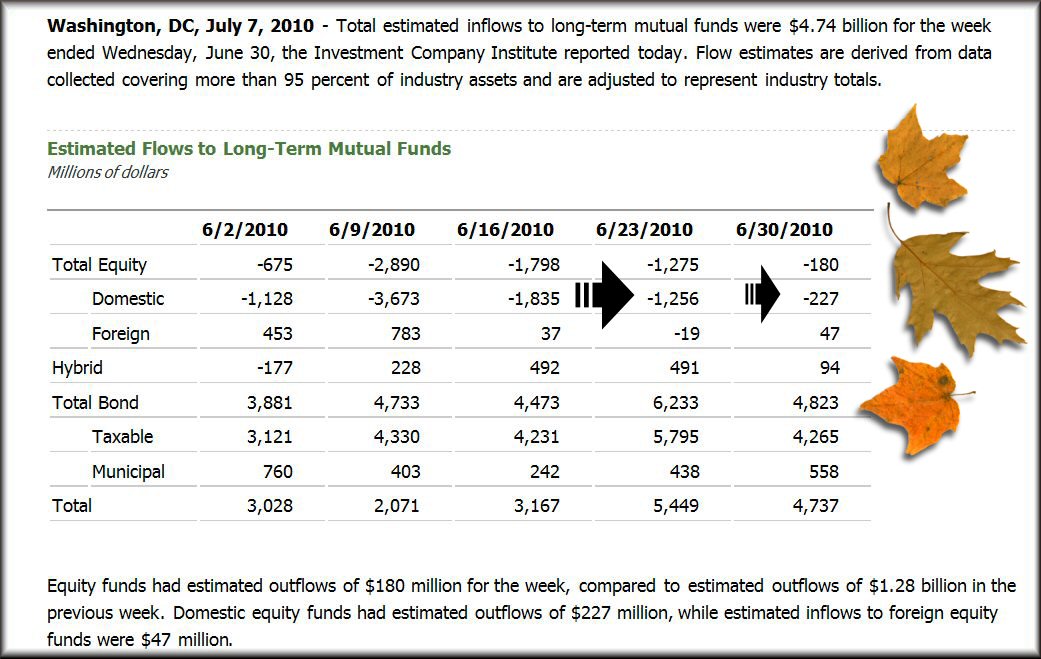
Well, that should about the nine straight weeks of money outflow from equities again. Pessimistic Americans? Or they really, really think extremely lowly of their stock market?

2. handful of large retailers report solid sales.

Mike "Mish" Shedlock wrote the following: Following Yesterday's Hype of Fastest Growth in 4 Years, June Retail Sales a "Mixed Bag" ( a recommended reading )

  • Retail Winners Exceeding Expectations

    J.C. Penney Co. (JCP) sales +4.5%
    Macy's (M) sales +6.5% w
    Nordstrom (JWN) sales +14%
    Ambercrombie & Fitch (ANF) sales +9%

    Retail Losers Not Meeting Expectations

    Target (TGT) sales +1.7% vs. expectations of +2.7%
    Kohl's (KSS) sales +5.9% vs. +6.5% expected
    Teen retailer Wet Seal (WTSLA) sales -3.6%
    Gap (GPS) sales flat

    Those numbers may seem pretty good but June sales benefited from a late Memorial Day that pushed sales into June. Moreover, June is normally a stronger month than May. More importantly, note how estimates were ratcheted lower as the month progressed.

    At the beginning of June estimates were +3.8% in aggregate but by the end of the month the estimates (and numbers to beat), were a mere +3.2%.

    Discounting was steep.

    Here is one of the most telling comments from the article "Retailers that surpassed analysts' expectations were mostly quiet about increasing their second-quarter guidance, raising questions about how much the promotions, while aiding sales, came at the cost of lower profit margins on the items."

Yeah, these buggers were all talking about 'sales' numbers. And needless to say, lower profit margins and lower pricing would surely induce more sales!

And talking about Mish, he was featured on FinancialSense.com with a rather very significant editorial: Consumer Credit Drops Whopping $24 Billion in 2 Months. Do give it a read. ( Oh, ZH wrote on this also: Consumer Credit Plunges In May, April Revised Much Lower, As Government Only Marginal Lender For Two Months In A Row )
