Saturday, April 30, 2011

What Do You Look For In A Report? Ms. Sexy Stock?

Sexy story sells! It pushes the stock high up.

LOL! That's probably the under statement, yes?

And get this, once the sexy story is out, the wok is ready, the chef is ready, it's pointless to talk logical sense and logical reasoning. The wheel is in motion and the stock is all a-go-go!

And needless punters, speculators and traders love it to bits!

Hey, who doesn't want to be a billionaire?!

And needless to say, some investors are utterly aghast to see what's happening. They know the report doesn't make much. Some even goes all out and try to warn others about the danger that lies ahead. To these kind hearted, they know it's all a pump-and-dump play in the making.

But alas, the story is simply too darn sexy. And the wok is super hot too!

And the stock flies to the moon.

And the kind hearted? They are like a tortured soul with their warnings.

And perhaps this might be a tortured posting for some too!

Ah.. what's prompting this posting? Well? My soul is definitely not tortured. LOL! How could it be? I am not a too kind hearted soul, to begin with. (I wonder if it does matter). Anyway, there I was reading and glancing through this earnings reports last night. Then I saw the name. That name. I just had to open and have a look at what's happening. And seriously, I was not too shocked at all. And since there were postings on the stock before, I decided to do a do-over posting.

Let's travel back to 6 Feb 2007.


The stock in feature is AsiaEP.

And as clearly seen, AsiaEP was trading below 20 sen for a large period of time back in 2006. Then in Dec 2006, it started climbing and climbing. And by 6 Feb 2007, it closed the day trading at 0.355 sen.

Up so much already woh. And then here come KN with its guns blazing claiming that AsiaEP is our country's "A homegrown Google and Baidu in the making"!

Sounds sexy enough?

In a 8 page report on a relatively unknown Masdaq stock (now ACE stock), KN gave the market an incredible initiation report.


Quantum Leap. AsiaEP Bhd (“asiaEP”) has developed a Specific Community/Vertical Search Engine (“Itah SE”), which offers a simpler, deeper and more relevant search for B2B users. We expect significant B2B traffic to enable the adoption of a highly lucrative Pay Per Click (“PPC”) revenue model.


A homegrown Google and Baidu in the making. Visit the site: http://b2b.itah.com/ and compare Itah SE with Google’s generic Search Engine (“SE”) by typing in keywords that may link to any products, and then check the returned results from the perspective of a businessperson. You will be pleasantly surprised by Itah SE’s search results’ simplicity and high relevancy – just what a businessperson needs. We believe Itah SE has the potential of becoming a popular B2B SE.


The sky is the limit on successful execution. Assuming a mere 0.2% and 0.5% of the FY08 and FY09 global B2B paid search market share would lead to a 184.7% and 115.2% y-y growth in net profit to RM10.1m and RM21.8m, respectively.


When everything is “right”, the share price will likely be “wrong”. Investors have two choices. Buy early if one thinks Itah SE has a reasonably good chance of achieving success. Alternatively, one can buy on earnings delivery later but at likely much higher prices.


STRONG BUY with a 12-month target price of RM0.99, which is based on a FY09 P/E of 10.0x. We believe Itah SE is worth a lot as a technology. Wall Street will not accord Google and Baidu with a market capitalisation of US$149b and US$4.0b otherwise. Moreover, players without a strong presence in the paid-search space, such as Microsoft, EBay and etc., may be willing to pay top dollars for Itah SE once proven.
And of course, as in most reports, the 12-month target is based on a very optimistic future earnings. In AsiaEP's example, the target price hinges on the estimates of what AsiaEP could earn in FY 2009.

And here's the earnings estimate table once more.

So AsiaEP was a company that was making just 3 million. But because of this new project, this "A homegrown Google and Baidu in the making", AsiaEP earnings could soar to 21.8 million.


Oh yes. The company was making just 3 million. And the research report said it can and because it can, it rates AsiaEP to be worth a whopping 99 sen based on the fact that earnings could fly to 21.8 million!


Aha...that's the sexy story told.


And as you know in the market, a stock's future price is based in what it could earn in the future.


That's written in the stone dude and dudettes.


You can NOT re-write what's written.


You can not even argue.


NO. NO. and NO.


It's a like miner. Whether it successfully mine its gold is never important. What's important is what it could mine.


Think about it.


This is the stock market.


It's what the company COULD earn in the future. That's all that's important.


Nothing else matter. Remember that yo!


Err... errr.... yes you cannot be a smartie pants and start suggesting that by making such a stone cast ruling, anyone can just start painting a bright future prospect and the stock could fly to the future and beyond!


No you simply cannot do that.


And what did AsiaEP do after such a sexy report?


Fly it did.


By 26 Feb 2007, the stock was trading at 0.82 sen!


By no one cared about that stock report already.


AsiaEP is simply a darling. No one simply cared about the negative coments posted on AsiaEP.


They certainly did not care about postings such as Update on AsiaEP. Oh yeah, even Goldman got involved in this puny stock. Goldman woh! Don't main-main!


If Goldman buys, then it must be good. ( Duh! LOL! )


Let me re-peat what was written in the posting Update on AsiaEP.


Truly incredible. (Mou Tak Teng!)

On feb 6th, I mentioned AsiaEP in the following posting: AsiaEP

On Feb 24th, the Star Bisweek carried this article: Googling for growth

On March 9th the Edge reported the following: 09-03-2007: Goldman Sachs buys 5.7% stake in AsiaEP

On March 9th, KN came out with their guns blazing and gave AsiaEP a price target of rm1.97 ( the initial TP was just 0.99)

KN calls it the Goldman factor and this is their reasoning:

VALUATION AND RECOMMENDATION
While our FY07, FY08 and FY09 earnings forecasts remain unchanged (Please refer to our Initiation Report dated 6 February 2007), investors should not under-estimate the positive impact of GSI’s presence in asiaEP for the following reasons:


  • Emergence of GSI as a substantial shareholder in asiaEP could lend Itah SE instant credibility – a big vote of confidence on its business potential;


  • Presence of GSI could enhance deal possibility between asiaEP and other BIG SE players on Wall Street; and


  • Deal potential tends to inflate valuations.

We continue to rate asiaEP a STRONG BUY with a revised 12-month target price of RM1.97 (+99.0%), which is based on a FY09 P/E of 20.0x. Increasing foreign interests, who seem to better appreciate the company’s growth potential, to a large extent, drives the latest re-rating.

........ LOLOLOLOL!

Got the Goldman factor woh.

And naturally, the stock continued to the orbit. Some would say KN's report is damn MTT (Mou Tak Teng!)


See? Don't say I told you so but it's pointless to talk fundamentals. Most important is the sexy stock report and the stock in the wok.

And the buyers, punters, speculators, traders in the stock were so happy.

How could they not be.

And naturally these winners would be rubbing it in to all the troubled souls who had criticised the stock.

All that matters is the stock had reached KN's initial price target. That's all that's important.

The reasoning? What reasoning? Who cares?

Do they care how the stock traded comes Christmas?

Heck no!

Got great profit! Why bother?

They certainly did not care that stock looked like this comes Christmas eve 2007.

!!!!

To them, this posting is simply an annoyance to the world wide webspace.

It contributes NOTHING positive to the market at all.

Zip!

And that was 2007.

It's now 2011.

Last night AsiaEP announced its earnings.


Losses of 31.2 million?

WOW!

Now the losses were explained..

In response to the current volatility of the world economic conditions affecting the local market as a whole, the Management decided to adopt a prudent stance by providing an impairment on the intangible assets amounting to RM28.268 million during the current quarter ended 28 February 2011. This has resulted in the Group recording a consolidated loss of approximately RM31.256 million for the current quarter ended 28 February 2011 (before taking into account the aforementioned impairment, it would have registered a consolidated loss of only RM2.988 million), compared to the corresponding quarter of the preceding year ended 28 February 2010 when the Group registered a consolidated loss after taxation of approximately RM0.942 million. In view of the aforementioned market condition, the Group revenue generated was approximately RM 0.234 million for the current quarter ended 28 February 2011 compared with approximately RM1.633 million as posted in the preceding year crresponding quarter.

An impairment of intagible assets amounting to rm28.268 million?

What is this impairment of intagible assets? What is AsiapEP intangible assets in the first place? Why is this intagible asset that is worth so much?

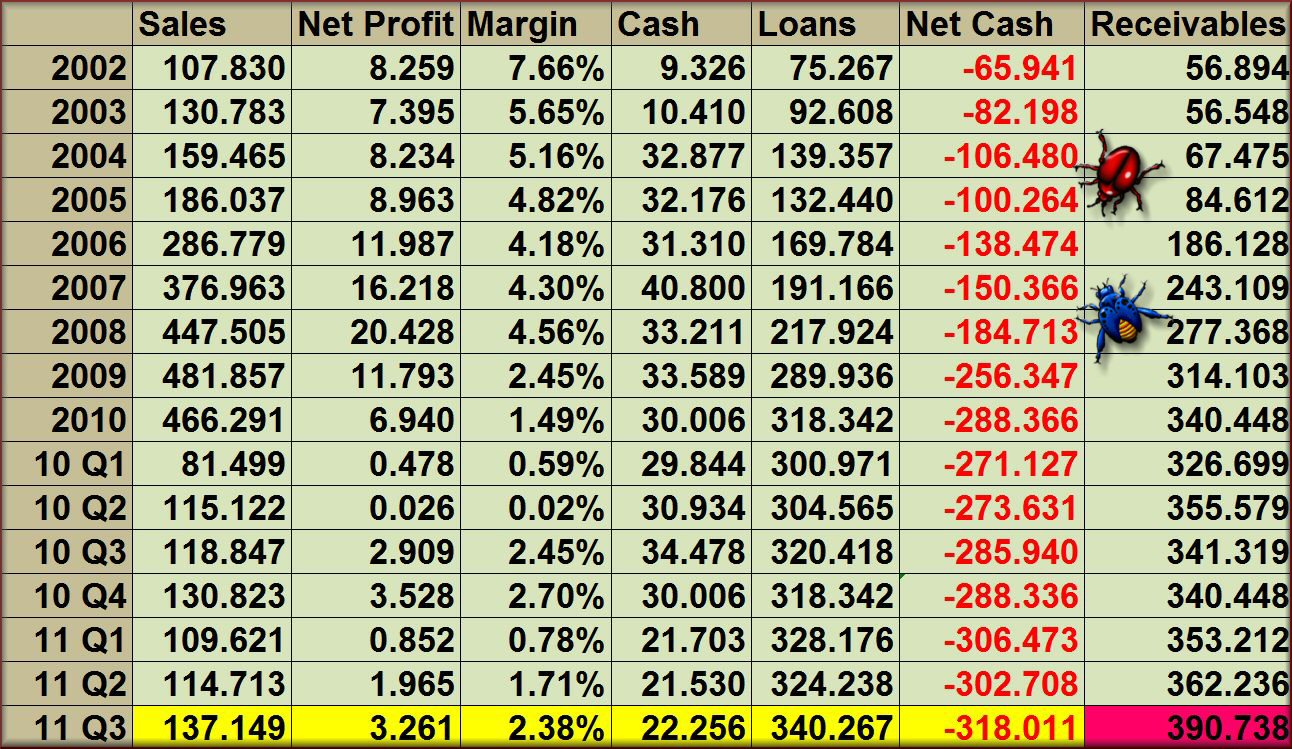
And the company's balance sheet fundamentals?

Well there's nothing really nothing to talk about! (pun is really intended)

Company does not have any loans but neither does it have cash either. It just have some 548 thousand (yeah thousand!) left in its piggy bank.

But the most important thing is..... a sales revenue of 234 thousand???

Err... company doing business or not?

And then... after all such a long posting already.... I remembered about KN's report. Sorry KN's sexy report on AsiaEP. I wondered how AsiapEP had fared for its fy 2009 earnings. Remember KN said AsiaEP should be earning some 21.8 million!

Here's the link to AsiaEP FY 2009 Q4 earnings: Quarterly rpt on consolidated results for the financial period ended 28/2/2009

Ahem! Ahem! Ahem!

According to that quarterly earnings, AsiaEP lost some 7.46 million for fy 2009!

KN's estimate? An earnings of 21.8 million! ( Does anyone care about this issue anymore? )

Ahem!

And naturally.... the stock now looks like this.

MaeMode's Earnings Increased But ....

Here's an update to the postings on .

Maemode announced its earnings last night.

I could actually use the same template as what was posting last on MaeMode on 29 Jan 2011, Update On MaeMode

1. Sales. Improved.
2. Earnings Improved.

Checked. For both once more. Yes, sales and earnings did improve sharply. To be more precise:

In 2007 it made 16.218 million.
In 2008 it made 20.418 million.
In 2009 it made 11.793 million.
In 2010 it made 6.940 million.
2011 Q1 it made 0.852 million.
2011 Q2 it made 1.965 million.
2011 Q3 it made 3.261 million. *latest*

But yet again, the simple question is the improvement good enough?

And here's the updated table.


As can see, the fundamental weakness in MaeMode's balance sheet is rather clear. Debts increased (once more) and again the increase in receivables is frightening!

Let's ask some simple questions.

Take the latest quarter-to-quarter comparison, ie let's compare fy 2011 Q2 numbers with fy 2011 Q3 numbers.

So sales revenue increased from 114.713 million to 137.149 million. This is an increase of 22.436 million. And the reported net earnings increased from 1.965 million to 3.261 million, or an increase of 1.296 million.


But look at the loans. Its loans increased from 324.238 million to 340.267 million! An increase of 16.029 million.


And the receivables? It has now ballooned from 362.236 million to 390.738 million! Or an increase of 28.502 million!


And of course, here's the daft question once more.


Why MaeMode do business with collecting money one?

Wednesday, April 27, 2011

Sir Ryan!

The What IF Blue Sky Valuation Strikes Once Again

And ................. OSK strikes again!

Slightly more than a year ago, on March 2010, OSK wrote a report on MMC. Their head of research introduced a brand new yardstick called Blue Sky valuation.

I kid you not!

Let me reproduce what was posted on March 2010: OSK's What If Blue Sky Valuation!Today the same writer is pulling the very same stunt!


Truly amazing la.

Is it too much asking to ask the writer to come up with a better seduction method? As it is, it's rather same old, same old.

Anyway, what do we have?

Today we have What IF.

Oh, he added the BLUE SKY valuation!

OMIGOD! OMIGOD!

I kid you not!

I guess this is the first of the kind in the world.

Ho ho ho ho!

Mr. Blue Sky!

ROFLMAO!

First he states the risk in one small passage...


Then he comes out with his gun banging...


So if my Blue Sky comes, the fair value is rm 3.26. Else it's a plain boring price of 2.41 with an un-seductive target price of rm 2.80!


------------


And so how did MMC fared? Well apparently it was cloudy and Mr. Blue Sky was not to be found: Comments On MMC Earnings


And the remarks on MMC's earnings was remarkable. So What Is OSK Saying Now About MMC


And that was then.


Now is 27th April 2011 and OSK head of research is now no longer talking about Mr. Blue Sky. Instead it's the CROWN JEWEL...


ps: Naturally the SOP (sum of parts) value is increased.
A good trade. With Syed Mokhtar definitely appearing to be in the good books of the government currently, we do expect that it will only be a matter of time before something comes MMC’s way. As such, we maintain our Trading Buy call on the company with our SOP fair value unchanged at RM3.62.


Want To Invest In Chinese Stocks Listed Overseas? Read This First!

On the Financial Edge:

Lessons in handling S-chips for SGX
Written by Leu Siew Ying
Tuesday, 26 April 2011 10:46

Anne Stevenson-Yang wanders into a large conference room in between corporate presentations and meetings during a glitzy investment confab in Shanghai and finds rows of tables manned by representatives from small accounting firms and investor relations outfits hoping to snare Chinese companies seeking overseas listings as their clients. The event is the Rodman & Renshaw Annual China Investment Conference, which was held at Shanghai’s Le Royal Meridien Shanghai last month and was said to have featured 150 presenting companies, a live performance by 1990s R&B band En Vogue and drawn some 1,000 attendees.

US investment bank Rodman & Renshaw was looking to connect Chinese enterprises looking for cash with investors in the US and to facilitate introductions with the various providers of corporate services the enterprises will need as public listed entities in the US. And, despite a string of stories recently of egregious fraud and corporate governance scandals at US-listed Chinese companies that wouldn’t be unfamiliar to investors in Singapore’s S-chips, business was evidently booming.

Stevenson-Yang was at the Shanghai investment conference for a somewhat different reason, though. The managing partner of J Capital Research provides independent research on Chinese companies, which she says are often poorly understood in developed markets. Just weeks before the Shanghai conference, J Capital Research had published a report alleging that Xian-based fertiliser maker China Green Agriculture had been inflating its revenue. Among other things, the report cited discrepancies in revenues reported by the company in the US versus revenues reported by its key operating unit in its filings with China’s authorities. That sparked a steep sell-off in its US-listed shares.

China Green Agriculture, which is already under investigation by the US Securities and Exchange Commission (SEC), later issued a letter to its shareholders, responding point-by-point to the J Capital Research report. Among other things, it said that there are differences in accounting standards in China and the US, and that companies do not reveal all their financial information to China’s authorities for fear of losing their competitive edge if the information were to become public.

Whatever the case, accounting irregularities and corporate governance issues at US-listed China companies are now making investors there as nervous as investors in Singapore are about S-chips. In fact, the spate of bad news prompted SEC commissioner Luis Aguilar to remark that the number of Chinese companies with accounting deficiencies or that are “outright vessels of fraud” seems to be growing.

That’s spurring business for the likes of Stevenson-Yang and J Capital Research, as hedge funds and bear raiders scramble for information about US-listed Chinese companies to take short positions in their shares. Another company benefiting from this negative interest in Chinese companies is Hong Kong-based Muddy Waters Research, a firm founded by US lawyer Carson Block. In November, Muddy Waters published a report on Rino International Corp, alleging that the accounts of the water treatment equipment supplier based in Dalian had “serious flaws”. That sparked an investigation by the SEC and eventually led to the suspension of trading in the company’s shares on April 11.

Then, there is OLP Global LLC, which bills itself as an “alternative” research and consulting firm with a track record of “bridging the information and research gap” between companies and investors. Earlier this year, OLP alleged there were questionable dealings at US-listed ChinaCast Education Corp, but no action has been taken on the company so far. Interestingly, ChinaCast Education was originally listed in Singapore as ChinaCast Communication Holdings. In 2007, it was delisted following its acquisition by a US-listed company called Great Wall Acquisition Corp.

Not all of these firms confine themselves to producing “negative” research on Chinese companies, though. In fact, J Capital Research says it began examining China Green Agriculture because it was initially excited about its prospects. It was only after it looked closely at its business that it discovered what it believes to be evidence of inflated reported revenues. Yet, demand for such negative research is clearly growing, says Stevenson-Yang, because of a “clash of civilisations” when Chinese companies are listed in developed markets.

According to her, analysts and investors in developed markets are incapable of examining Chinese companies properly. Besides differences in accounting and financial reporting standards, companies in China just don’t work the same way as in developed markets. “And, if they list overseas, [China’s] attitude is that what happens there is none of its business as they are regulated by the overseas regulator,” Stevenson-Yang says. That creates a “black hole” that enables unscrupulous promoters to take dodgy Chinese companies public overseas, supported by a host of fly-by-night accounting firms and investor relations outfits, she adds.

To be sure, not all Chinese companies that seek overseas listings are fraudulent
. Yet, the methods that analysts and regulators in developed markets use often aren’t sufficient to separate the ones that are from the ones that aren’t. “Investment bankers and research analysts do not begin with the point of view that the [financial] reports are incorrect,” Stevenson-Yang tells The Edge Singapore. “You don’t assume that people are lying to you.”

Even when Chinese companies are genuine, investors don’t always understand the business ethos in China and they underestimate the potential for things to go wrong after the company is listed. “To a Chinese entrepreneur, IPO capital is just revenue. It’s for the taking and not for building the company,” says Stevenson-Yang. And, if the business performs poorly or begins to fail, some companies have little compunction in fabricating their financial accounts to keep their share prices up and continue raising cash, she adds.

Benefit of ‘negative’ research
Such views might seem fanatically negative in a market like Singapore, where analysts tend to express deeply unenthusiastic sentiment on a stock by simply dropping it from their coverage. Yet, the absence of “negative” research in the local market hasn’t left S-chips any better off than China stocks listed in the US. On the contrary, in recent months, S-chips like China Gaoxian Fibre Fabric Holdings, Hongwei Technology and China Hongxing Sports have crashed and then been quickly suspended after giving investors only scant explanation of what exactly has gone wrong.

Peter Choo, who organised the listing of several S-chips over the past decade, first at DBS Bank and later at Westcomb Securities, a boutique investment bank he founded, says the Singapore market would be better off if the negative research and shorting activity promoted by firms like Muddy Waters and J Capital were more widespread here.

“They are superior to analysts,” he says, noting that some of these firms not only provide information to short-sellers but also take short positions themselves. “They spend a lot of money and time investigating a particular company and they put their money there to short the stock. If they make money, well and good. We must have this kind of community.”

Besides alerting investors to trouble brewing at companies, such firms might also help uncover questionable behaviour by investment banks, accounting companies and investor relations firms. In her report on China Green Agriculture, Stevenson-Yang says the company is surrounded by a cluster of US-based promoters “whose record at best presents weak judgment and at worst could suggest a cross-border collaboration to defraud”.

These US promoters, she says, have worked closely with a group of investors in Shaanxi, one of whom was jailed for four years in China for securities fraud and indicted in the US. Roth Capital, the underwriter of an issue of US$25 million worth of new shares for China Green Agriculture in July 2009, also has a pattern of backing problematic companies, Stevenson-Yang claims. Its clients include Orient Paper, ChinaCast Education, Fuqi International and Harbin Electric, which are alleged to have misrepresented their results.

Stevenson-Yang says the SEC ought to bar reverse takeovers, which appears to be the route that many troubled Chinese companies took to obtain their US listings, and start prosecuting the investment banks, accounting companies and investor relations firms that are colluding with these companies. “It’s not going to get rid of fraudulent companies, but it will reduce their numbers,” she says.

That already seems to be happening now. The SEC established a special unit late last year to investigate reverse takeovers. The probe is reportedly targeting Chinese companies and a web of small investment banks, accounting firms, law firms and investor relations advisers.

Obtaining negative and even incriminating information from a company and its promoters to support a bearish call on its stock is no easy task for an independent analyst, though. Stevenson-Yang says she and her team often rack up costs in the region of US$100,000 (RM299,000) for research on a single company.

With the lack of short-selling activity in Singapore, can analysts who specialise in negative research make money in the local market? How can local investors tell a good S-chip from a bad one? What can the Singapore Exchange do to prevent the slew of accounting irregularities and corporate governance problems at S-chips from poisoning sentiment towards the whole sector and derailing its efforts to turn itself into a capital-raising hub for promising young companies?

Inherently risky
Stock exchanges in the US, UK and across Asia, including SGX, have worked hard over the last few years to attract Chinese companies. Now, shares in these companies trade alongside shares in well-established companies in those markets. Yet, Stevenson-Yang says Chinese companies listed overseas are inherently risky and unsuitable for many investors. In her view, pension funds and mutual funds looking for steady returns should avoid them, because of the high chance of fraud or corporate governance failures.

Indeed, the victims in these cases haven’t just been small mom-and-pop investors but major institutions with the resources to do extensive due diligence
. For instance, private equity firm The Carlyle Group held a 10.9% stake in China Forestry Holdings and a 16.5% stake in China Agritech. Hong Kong regulators suspended trading in China Forestry after its CEO sold a huge block of shares and its auditors uncovered “possible irregularities” in its FY2010 accounts. China Agritech received a delisting notification from Nasdaq on April 12 after a self-professed short-seller, LM Research, called the company a scam and said its factories were all idle.

Even so, few exchanges, bankers and investors are likely to completely avoid Chinese companies because of the tremendous opportunity for growth they offer. “Despite the troubles, we must continue to engage China businesses for obvious reasons,” says Choo. “The benefits of having S-chips outweigh the negatives. No one ever gets full marks or 100% success.”

Investors with the stomach for such risk ought to size up their targets from first principles, rather than rely entirely on their financial reports. As Stevenson-Yang sees it, investors should simply avoid a Chinese company if they have never heard of the products it sells, or if their products have no comparables. She also recommends being wary of companies that keep raising funds, even when their books show they are flush with cash.If a company wants to prove it’s for real, then if they have cash, they have to pay dividends,” she says. Also, watch out for small companies that provide precise earnings forecasts that they then meet without fail, she adds, especially if those companies are using the services of second- or third-tier auditors, investment banks and investor relations firms.

Attorneys at US law firm Robbins Umeda, which is helping shareholders of China Century Dragon Media file a class action suit against the company, advise investors to scrutinise a company’s corporate governance record. That includes its policies and practices on insider trading and related-party transactions. “Good corporate governance, although not foolproof, tends to decrease the likelihood that fraud or insider misconduct will damage a company,” the firm’s attorneys Brian Robbins and Gregory del Gaizo say, in an email response to questions from The Edge Singapore. Large investors can also have their investments monitored by a law firm in order to alert them to corporate misconduct or fraud, they add.

Robbins Umeda says it has handled a dozen cases of irregularities at US-listed Chinese companies so far, and that number is likely to keep rising. “It feels like almost every day that there is an announcement of irregularity at a Chinese company listed on an American exchange,” its attorneys say in their email.

Regulation versus liberalisation
In Singapore, regulators have responded to the surge in reports of irregularities and corporate governance failures over the last few years by demanding higher levels of compliance with the rules. Earlier this year, SGX directed S-chips to beef up their controls and ordered their audit committees to conduct an internal review and file a report by May 31. Bankers and officials at S-chips say SGX has been sending out such notices quietly from time to time, since 2009, when auditors for Fibrechem Technologies found the company was reporting inaccurate cash balances and receivables.

Investment bankers also say that SGX has asked them use private investigators to check the backgrounds of companies they bring to market, and this has now become standard practice. SGX maintains a list of errant directors and it also requests for information on consultants who refer IPO deals. In addition, it requires the professionals involved in an IPO to sign off on the prospectus to ensure they have done thorough due diligence.

What is the result of all these efforts? “There is no gross negligence. I am speaking for everybody, because I have worked with all of them,” says Choo, referring to IPO managers and bankers who are licensed to operate in Singapore. “I think they are all up to the mark. But how can you tell when a boss is unscrupulous?”

Indeed, even as instances of irregularities and corporate governance failures continue to come to light, obtaining and maintaining a listing in Singapore is getting tougher for promising young companies, some market watchers say. A comparison of the thickness of listing prospectuses filed in Singapore versus markets such as London’s AIM and the Australian Securities Exchange is telling.

The latest Catalist prospectuses are 200 to 300 pages long, whereas recent prospectuses lodged with ASX vary from 64 to 220 pages. Meanwhile, companies seeking a listing on AIM only have to submit a form providing rudimentary information that covers not even a dozen pages. AIM’s listing regulations run into a mere 137 pages, while Catalist’s listing rules are contained in 14 chapters with several sections each, not to mention appendices and practice notes.

With the ease of listing, AIM has attracted more than 3,000 companies since it was set up 16 years ago. The companies listed on the market don’t attract much analyst coverage and they don’t stay forever. Yet, it is vibrant enough to keep attracting investors as well as companies looking for capital from around the globe. Some 450 of the 1,174 companies now listed on AIM operate outside the UK, in more than 100 countries. How does AIM regulate these companies? A spokesman for the exchange says companies that flout listing regulations are fined or publicly or privately censured. At worst, they are booted off the board. Cases of fraud are referred to the authorities, the spokesman says.

In Australia, early-stage mining companies are able to obtain listings on ASX with ease, even though they are highly risky and many ultimately fail. Yet, the market has an investor base that accepts such risks. “They intuitively understand the business and they have gone through the learning curve,” says an analyst who covers SGX. That makes ASX a vibrant market for junior mining and natural-resource companies.

“SGX is doing a lot, but I’m not sure more regulation is the answer,” the analyst adds. According to Choo, for a company to obtain and maintain a listing on Catalist is now no less onerous than on the Mainboard. Moreover, the sponsorship system and listing requirements make listing fees expensive on Catalist relative to other exchanges that also target start-up companies, he adds.

Now, some market watchers are suggesting that SGX simply set basic rules to ensure that companies are what they hold themselves out to be, and then spare them the cost of tough regulation.

While that won’t reduce the number of companies failing, it would increase the number of listing aspirants willing to take a chance on a Singapore listing.

Choo says there is a big pool of investors in the region willing to take high risks for potentially high returns and that Singapore now has a window of opportunity to turn itself into the AIM of Asia. “That is the strength of Singapore, but it takes courage to do it. It takes a different mindset.”

Such a mindset might also see the value of having short-sellers and research firms like Muddy Waters and J Capital Research hunting for companies that might not be what they claim and taking them down. Meanwhile, Stevenson-Yang says she is unmoved by the point-by-point rebuttal of her report on China Green Agriculture by the company’s CEO.

“I read his letter and did not see any substantive points.” She insists that she had tried to engage the company while working on her report, but did not get adequate responses to her questions. “I gave them ample time and details to respond to my report and they did not respond. The letter was just hot air,” she says. — The Edge Singapore


This article appeared in The Edge Financial Daily, April 26, 2011.

http://www.theedgemalaysia.com/in-the-financial-daily/185646-lessons-in-handling-s-chips-for-sgx.html

You might want to read this: Featured Posting: China Integrated Energy (CBEH): The Latest Alleged Chinese Fraud

Great Cover From Sara

Love this!


ps: Oh yeah! 2-0. :D

Friday, April 22, 2011

Yes, RHB DID Change Its Fair Value On JCY!

From the posting: QC And The Research Reports

  • limko said...
    It is not an isolated case in OSK's report on Axiata or MMC, it is the same with RHB's report on JCY which came down from around 1.8 to 0.8 and then 0.22 back to 0.8 recently, all in matter of months if not weeks.

It was a very interesting comment because I was not aware that RHB had made such a drastic adjustment in its fair value call for JCY.

Why?

Because there wasn't a new report released on JCY! Not that I was aware of.

As far as I was aware of, RHB's downgrade of JCY to 22 sen was under the report "JCY International Berhad : Back To Black, But Disappointing Again". It was published on 28 Feb 2011. This was highlighted in the posting http://whereiszemoola.blogspot.com/2011/03/is-rhbs-downgrade-of-jcy-and-fair-value.html

Now get this.

Thanks to limko, I now realised that RHB changed its views on JCY.

And no, they did not make a new report.

Now thanks to limko, I was told to look for 5th April 2011. Yes, on 5th April, just 5 weeks after downgrading JCY to 28 sen, RHB revised its call on JCY under the report "Semiconductor: Slight Drop MoM In Feb, But Stronger YoY Growth'.

I kid you not!

Yes, surely RHB could have made a whole new report on JCY itself, right? It's a massive upgrade, yes? Why mention it in a semiconductor sector report? Is JCY even a semicond stock?

Glee!

This is seriously not right!

Here's the screen shot.


And their reasoning?


  • .... JCY: Beneficiary of the industry’s consolidation. We believe JCY could benefit from the industry consolidation as this could reduce pricing pressures. In addition, JCY could potentially secure higher volume loading for new HDD components from the enlarged WD. Therefore, we have raised our FY11-13 net profit forecast by 241.5%, 224.5% and 167.8% respectively to reflect: 1) higher margin assumptions as we believe the average selling price would remain stable; and 2) higher revenue assumptions on the back of improving corporate and consumer spending. Furthermore, we have rolled forward our valuation to base year to CY11 (from FY11). Correspondingly, we have raised our fair value to RM0.81/share based on 10x CY11 EPS. We upgraded JCY to Market Perform in our strategy report dated 31 March (from underperform previously).

huh? They raised their net proft forecast for JCY by 241.5%, 224.5% and 167.8%????

WOW!

And on 31 March, RHB had upgraded JCY to a market perform????

I then had to dig up that 31 March report, titled 'Market Outlook & Strategy 2Q2011 : Climbing The Wall Of Worries'.

Page 55 of the report:


  • We believe JCY could benefi t from the industry consolidation as this could reduce pricing pressures. In addition, JCY could potentially secure higher volume loading for new HDD components from the enlarged WD. Therefore, we are raising our FY11-13 net profi t forecast by 241.5%, 224.5% and 167.8% respectively to reflect: 1) higher margin assumptions as we believe the average selling price would remain stable; and 2) higher revenue assumptions on the back of improving corporate and consumer spending. Furthermore, we have rolled forward our valuation base year to CY11 (from FY11). Correspondingly, we have raised our fair value to RM0.81/ share based on 10x CY11 EPS and we, therefore, upgrade our call on the stock to Market Perform.

Seriously?

With such a massive earnings forecast upgrade, shouldn't RHB released an individual report on JCY?

I might be wrong but by mentioning JCY and revising the forecasts in other reports, it's rather snakey! Yes, it feels snakey too me! (Hey that's my flawed opinion! )

Just incredible!

***** I have to add this: I do not know and I do not care how JCY the stock will trade. I am just utterly flabbergasted on how RHB could make such a drastic change in opinion on JCY fair value.

Different. Just Different.

Sometimes it's best not to take what we read for granted!

Here's an article published on the Edge website last night: RAM Ratings cautious about Star Publications’ new investments

  • RAM Ratings cautious about Star Publications’ new investments
    Written by Joseph Chin of theedgemalaysia.com
    Thursday, 21 April 2011 19:33

    KUALA LUMPUR: RAM Rating Services Bhd is cautious about STAR PUBLICATIONS (M) BHD []’s new new investments may pose new risks to the group.

    The ratings agency said on Thursday, April 21 that in the near term, the group “may invest some RM60 million in new media assets”, that is television channels, radio stations, online media and event organising.

    “The group is expected to incur losses from some of these investments during their respective gestation periods given that they are fairly new businesses.

    “In addition, Star lacks experience in the TV segment, which is viewed to be more competitive than its mainstay newspaper business,” it said.

    RAM Ratings assigned respective preliminary long- and short-term ratings of AA1 and P1 to Star’s proposed up to RM750 million medium-term notes (MTN) programme (2011/2026) and proposed up to RM750 million commercial papers programme (2011/2018); both facilities have a combined limit of RM750 million in nominal value.

    Concurrently, RAM Ratings reaffirmed the AA1/P1 ratings of STAR’s RM350 million commercial papers/MTN programme (2005/2012). Both long-term ratings have a stable outlook.

    It said the ratings reflect Star’s dominant market position and robust financial profile. The Group’s flagship daily, The Star, remains the clear leader in the local English-language newspaper market, supported by its strong circulation and readership bases.

    RAM Ratings said Star’s balance sheet and cashflow-protection metrics remained strong as at end-December 2010; its gearing ratio had more than halved to 0.09 times (end-December 2009: 0.23 times), underscored by a lighter debt load.

    At the same time, Star retained its net-cash position. Led by its lower borrowings and stellar operating performance amid a more robust advertising market in 2010, the group’s funds from operations debt cover (FFODC) catapulted from 0.70 times to over 2 times.

    However, the ratings agency said the ratings remained constrained by the group’s susceptibility to economic cycles, its vulnerability to newsprint price volatility and the increasing prominence of other media platforms.

    While print advertising expenditure (adex) has expanded, TV and radio adex has been rising more rapidly.

    Circulation and readership of English-language newspapers have also been declining (although at a slower pace than in more developed nations).

    Nonetheless, it said print will remain relevant in the eyes of Malaysian advertisers, at least in the medium term.

    “Even factoring in additional borrowings for its investments, capital expenditure for the possible development of the Star media hub in Shah Alam and working capital, we expect the group to continue exhibiting conservative gearing levels and sturdy debt-coverage ratios.

    “Star’s gearing ratio is expected to be kept at around 0.3–0.4 times while its FFODC is envisaged to slip, albeit remain favourable at a minimum of 0.5 times over the next two years,” said RAM Ratings’ head of consumer & industrial ratings Kevin Lim.

Today, Star business decided to carry the same article.: RAM assigns AA1 and P1 to Star’s debt facilities


  • Friday April 22, 2011

    RAM assigns AA1 and P1 to Star’s debt facilities

    PETALING JAYA: RAM Ratings has assigned preliminary long- and short-term ratings of AA1 and P1 to Star Publications (M) Bhd’s proposed medium-term note and commercial papers programme of up to RM750mil respectively.

    Both facilities have a combined limit of RM750mil in nominal value.

    The rating agency has also reaffirmed the AA1/P1 ratings of the newspaper publishing group’s RM350mil commercial papers/medium-term note programme with a stable outlook.

    The ratings reflected The Star’s dominant market position and robust financial profile, RAM Ratings consumer and industrial ratings head Kevin Lim said in a press release yesterday.

    “The group’s flagship daily, The Star, remains the clear leader in the local English-language newspaper market, supported by its strong circulation and readership bases,” he said.

    Lim added that the group’s balance sheet and cashflow-protection metrics remained strong as at end-December 2010; its gearing ratio had more than halved to 0.09 times (end-December 2009: 0.23 times), underscored by a lighter debt load.

    At the same time, the group retained its net-cash position.

    “Led by its lower borrowings and stellar operating performance amid a more robust advertising market in 2010, the group’s funds from operations debt cover catapulted from 0.70 times to over two times,” Lim said.

    He expects the group to continue to exhibit conservative gearing levels and sturdy debt-coverage ratios, even factoring in the additional borrowings for the investments, capital expenditure for the possible development of the Star media hub in Shah Alam and working capital with gearing ratio expected to be kept around 0.3 to 0.4 times.

Can we spot the difference?


Can we?


Glee!


Here's the article from RAM website: RAM Ratings assigns preliminary AA1 and P1 ratings to STAR’s proposed debt facilities, reaffirms existing ratings


  • RAM Ratings assigns preliminary AA1 and P1 ratings to STAR’s proposed debt facilities, reaffirms existing ratings

    Published on 21 Apr 2011

    RAM Ratings has assigned respective preliminary long- and short-term ratings of AA1 and P1 to Star Publications (Malaysia) Berhad’s (STAR or the Group) proposed up to RM750 million Medium-Term Notes Programme (2011/2026) and proposed up to RM750 million Commercial Papers Programme (2011/2018); both facilities have a combined limit of RM750 million in nominal value. Concurrently, RAM Ratings has reaffirmed the AA1/P1 ratings of STAR’s RM350 million Commercial Papers/Medium-Term Notes Programme (2005/2012). Both long-term ratings have a stable outlook.

    The ratings reflect STAR’s dominant market position and robust financial profile. The Group’s flagship daily, The Star, remains the clear leader in the local English-language newspaper market, supported by its strong circulation and readership bases. STAR’s balance sheet and cashflow-protection metrics remained strong as at end-December 2010; its gearing ratio had more than halved to 0.09 times (end-December 2009: 0.23 times), underscored by a lighter debt load. At the same time, STAR retained its net-cash position. Led by its lower borrowings and stellar operating performance amid a more robust advertising market in 2010, the Group’s funds from operations debt cover (FFODC) catapulted from 0.70 times to over 2 times.

    On the other hand, STAR’s new investments may pose new risks to the Group. In the near term, it may invest some RM60 million in new media assets, i.e. television (TV) channels, radio stations, online media and event organising. The Group is expected to incur losses from some of these investments during their respective gestation periods given that they are fairly new businesses. In addition, STAR lacks experience in the TV segment, which is viewed to be more competitive than its mainstay newspaper business. The ratings also remain constrained by the Group’s susceptibility to economic cycles, its vulnerability to newsprint price volatility and the increasing prominence of other media platforms. While print advertising expenditure (adex) has expanded, TV and radio adex has been rising more rapidly. Circulation and readership of English-language newspapers have also been declining (although at a slower pace than in more developed nations). Nonetheless, we opine that print will remain relevant in the eyes of Malaysian advertisers, at least in the medium term.

    “Even factoring in additional borrowings for its investments, capital expenditure for the possible development of the STAR media hub in Shah Alam and working capital, we expect the Group to continue exhibiting conservative gearing levels and sturdy debt-coverage ratios. STAR’s gearing ratio is expected to be kept at around 0.3–0.4 times while its FFODC is envisaged to slip, albeit remain favourable at a minimum of 0.5 times over the next 2 years,” notes Kevin Lim, RAM Ratings’ Head of Consumer & Industrial Ratings.

    Media contact
    Low Su Lin
    (603) 7628 1071

Wednesday, April 20, 2011

QC And The Research Reports

From the posting, What Do You Look For In A Research Report? Part II
Mun Wai said...

  • How far do you think QC is checked at research houses? (first at the analyst level n then the Head of Research)
I do not know. Honestly. I am not in the industry, so I cannot write what I do NOT know.
However... I did think about it.... for many minutes. I did. :P

Then I realised the report featured in the posting What Do You Look For In A Research Report? Part II. The feature report on Timberwell was written by Chris Eng. He's now OSK head of Research.
So why focus on Chris Eng?
Do indulge in me for a couple of minutes.Now at the end of each report, the report are signed by the head of research and in OSK case, it's Chris Eng.


In the posting, What Do You Look For In A Research Report?, I wrote the following:

2. IS THE RESEARCH HOUSE CONSISTENT ON THE STOCK RECENTLY?

Are the reports consistent on the stock? Perhaps a past example would explain it clearly why this is important. 22nd July 2009, I posted Featured Report: OSK Research On Axiata Look at the end of the posting. It tracks the recent Recommendation history and price target for the stock.

  • 24th Dec 2008. Axiata 3.58. Maintain Neutral at 4.20.
  • 08th Jan 2009. Axiata 3.60. Maintain Neutral at 4.20.
  • 06th Feb 2009. Axiata 3.18. Maintain Neutral at 4.20.
  • 19th Feb 2009. Axiata 3.36. Maintain Neutral at 4.20.
  • 28th Feb 2009. Axiata 3.06. Maintain Neutral. TP lowered to 3.00.
  • 25th Mar 2009. Axiata 2.61. Take profit. Downgrade. TP lowered to 2.50.
  • 30th Mar 2009. Axiata 2.38. Upgrade to Neutral. TP at 2.50.
  • 28th Apr 2009. Axiata 2.10. Take profit. Downgrade. TP lowered to 1.73.
  • 20th May 2009. Axiata 2.32. Upgrade to trading buy! TP at 2.70.
  • 18th Jun 2009. Axiata 2.28. Trading buy maintained. TP at 2.70.
  • 08th Jul 2009. Axiata 2.42. Trading buy maintained. TP at 2.70.
  • 21st Jul 2009. Axiata 2.98. BUY upgrade. TP at 3.40.
On Dec 2009, OSK reckoned that Axiata was worth 4.20. It had a neutral call on it. Come Feb 2009, Axiata was worth only 3.00! Yeah, it's call is neutral! (LOLOLOL!). Then in April, Axiata is even valued worst. The call was TAKE PROFIT! ( YEAH... this is where everyone should scream their lungs out and shout O-M-G !!! What profit was there to take? It was just in Dec OSK said the stock was a neutral with a fair value of 4.20. It's now April and its a bloody TAKE PROFIT with a fair value of 1.73? Look the screenshots. This was not made up!) And a month later, Axiata value suddenly jumped from 1.73 to 2.70!!!! ( O-M-G!!!! Exactly!)

So how was that?

Now all those reports were signed by Chris Eng himself. You can verify it in the posting Featured Report: OSK Research On Axiata.

Now I am asking myself. Was there QC done? Did Chris Eng actually read those reports or did he just sign for the sake of signing?

Issue is simple. The stock was tanking big time. Sinking to new lows. But the analyst made the ULTRA confusing recommendation to 'Take Profit' on April 2009. How on earth does one take profit on a stock that is sinking to a new low? Wasn't cut loss a more precise and accurate call? And yet, the head of the research, signed that report.

So is there QC?

Does QC exist?

I do not know.

And is this an isolate incident?

Do I have more examples?

On March 2010, I wrote the following: OSK's What If Blue Sky Valuation! (report written by Chris himself.) (LOL! I had a great time laughing at that report last year and I had a great laugh when I re-read it once more)

So now the head of research made that report. (Please read OSK's What If Blue Sky Valuation! )

How did it fare? On May 2010, MMC reported its earnings. I posted Comments On MMC Earnings

Now Chris Eng had said " While we are conservatively sticking to our earnings forecast for now".

But the ultra sticky point was Chris Eng's conservative forecast earnings for MMC Corp was RM 424.2 million!!!!!!

Come lah..I was laughing to myself. How could this be considered conservative when the earnings forecast was assumed to grow at 79.3% this year!!!!!! Does earnings grow so easily????
Apparently it does according to Chris.

And MMC earnings for that quarter was only earned 34.4 million!!!
And naturally when I got a hold of OSK report that day on MMC, I had to make another posting, So What Is OSK Saying Now About MMC. Do give it a read.

How? Well, it was incredible for me! Amazing!
So is there QC?
Let's take another example. A random one.
On 7 July 2009, I posted the following: iCapital And Swee Joo.

Do give it a read. Swee Joo today trades at 18 sen!
And since you had asked, I too wonder if there was QC from iCapital?

Tuesday, April 19, 2011

Tricubes Get 50 Million Project!

On Bernama: ETP Has Garnered RM106.4 Billion In Investment


  • Tricubes Bhd will spearhead this RM50 million investment which also includes the development of a web portal, an email account for all Malaysian citizens aged 18 and above, a one-stop centre for government services, provision of value-added services such as social networking, checking bills online as well as payment, in addition to web development toolkits for citizens and business entities to creatively develop applications.


50 million project for web portal and email.....

..

29 Oct 2010: TCUBES-New admission into GN3

29 Nov 2010: Quarterly rpt on consolidated results for the financial period ended 30/9/2010


25 Feb 2011: Quarterly rpt on consolidated results for the financial period ended 31/12/2010

Apparently I am told that a facebook webpage had been created!!

And the stock EXPLODED up, up and away!


And suddenly the stock is valued some 12.7 million!

Here's a news clip: http://my.news.yahoo.com/twitter-malaysians-say-no-to-1-malaysia-email-072240178.html

Saturday, April 16, 2011

What Do You Look For In A Research Report? Part II

Price targets. Again for most market punters, price target is everything. Absolutely.

Eat porridge or eat rice also depends on how juicy the price target is.

All we can hear is '... but XYZ (brokerage house) said price target was 5.00 leh... so buy, buy, buyyyyyyy!' ( or is it bye, bye, bye? :P )

An infamous old story retold. It was 11 March 2004. The stock last traded 4.16. The stock had already gone up a lot. Seriously a lot. ( Exactly a year ago, before the stock was trading at 4.16, it was trading less than 90 sen! )


That was a massive movement, yes?

And the stock? Seriously? Its fundamental was shocking. :P

March 2003: Quarterly rpt on consolidated results for the financial period ended 31/12/2002. It reported yearly loss of 6.6 million. The previous year it lost 7.4 million.

But yet... somehow.. miraculously... its shares were in demand. Yes, somehow, someone in Aug 2003, had the hindsight to buy a 10% stake in this loss making company.

Private Placement of 4,725,000 new ordinary shares of RM1.00 each ("Private Placement")

And somehow... in yet another miracle of miracle... the stock soared and soared... it flew up, up and away to the orbit. By 11 March 2004, it hit 4.16.

Now that 10% private placement investors must be much better than Warren Buffett! Bought 10% in Aug 2003 at 1.00. Comes March 2004, the shares were worth 4.16.

No need to even talk about the stocks fundamentals. Who needs fundamentals? Who cares if the company is losing money? Who really cares?

Do you care? Why you want to make so much noise? You no make money in it? Don't be a sore loser! Stop your moaning!

Even Bursa smacked the stock with the UMA or UNUSUAL MARKET ACTION .

And so there we were.

On 11 March 2004, the stock closed the previous trading day at 4.16 and in came OSK with an truly amazing, out of the world BUY recommendation on the stock, giving the stock a target price of 5.00!

Yo dudes! Yo dudettes!

This is the stock yo! It's worth 5 bucks a pop! And it's only trading at 4.16.

You want or not?

I was amazed. Seriously, that so-called analyst must be extremely skillful. No joke. It's not easy at all. The stock had ZERO earnings. Losing money. And the stock had almost gained 5 folds since a year ago. Yet, this analyst could come up with a BUY recommendation with a 20% call!

Now that's skills!

Eat your heart out Goldie!

Here's a screen shot.


As can be seen, at 4.16, the stock had a market cap of around 226.3 million!

This was the stock's most recent quarterly earnings before March 2004. (LOL! Now that's 10 years ago, babe! :P)

Quarterly rpt on consolidated results for the financial period ended 31/12/2003

Look at the revenue? 34 million only. Yeah revenue only. And yet the market is valuing the stock at 226.3 million already. ( ho ho ho .. life is good! (how many times must I tell you this?) )

And somehow, OSK young analyst then, could came up with a report, suggesting that this company is worth....... another 20% more! Gee another 20%? That means the stock's market cap is suggesting the company is worth 271 million!

It doesn't matter the stock lost money the last 3 years, it doesn't matter the sales turnover is only a mere 34 million! And it certainly matters not the poor balance sheet it has! It doesn't matter that it had net debts of over 50 million! And it seriously doesn't matter that the company had some 273 thousand ( that's not a typo! So stop starring at me! LOL! :P ) only in its piggy bank!

Good is good eh?


And incredibly, the analyst DID acknowledge the concerns of the stock's track record!


In an effort to learn more, let me reproduce by pasting the exact words:

Concerns on Track Record

Productivity after the lull

We note that Timberwell has not conducted large scale timber extraction for the past 3years and that its mills have run on low capacity since 2002. As such, there is concern that its productivity and EBITDA margins may be lower than that of its peers.

Net debt of RM54.8m

Timberwell may focus on clearing its debt before it pays out any dividend as its current interest expenses have averaged RM4m over the past 4 years. Nonetheless, with the increased optimism in the timber sector, Timberwell may be able to restructure or refinance its debts over a longer period.

Valuation

Fair value at RM5.00

We have estimated an average price of USD320 per cu m for Timberwell¡¦s plywood prices and USD360 per cu m for its sawn timber given the recent run up of prices. We have also forecasted a CAGR of 2.6% for plywood and sawn timber prices. Based on these estimates, our EPS forecast of 26.3 sen for FY04 means Timberwell is trading at 15.8x projected PER. This is a 16% discount to the timber sector PER of 18.8x as of 10th March. With the revaluation of FMU3 which will be submitted for approval this quarter, Timberwell is also trading at 0.9x of its book value.

Timberwell has outperformed the KLCI by over 200% since December 2003. This may reflect the growing realisation that its sustainable forest concession gives it a big advantage as long as the company is able to extract what has already been allocated to it. Based on our Discounted Cash Flow model, we value Timberwell at RM5.00 given its potential for long term stable earnings. The value is price sensitive, with a 1% increase in the CAGR of log, plywood and sawn timber prices resulting in a fair value of RM5.81 while a 1% reduction in the prices CAGR gives a fair value of RM3.95. The stock is currently trading with a potential upside of 20.2% based on assumed prices for log, plywood and sawn timber.

There you go.

Do you like the way the analyst had reasoned the stock should be worth that much?

First, "An independent valuation of FMU3 has priced it at RM220m. This translates into a huge jump for Timberwell's assets and a corresponding 4.12x increase in its NTA/share from RM1.21 to RM4.99" A re-evaluation of asset.

It then brushes aside the net debt issue. ( I wonder if the analyst saw the company had only 273 thousand left in its piggy bank!)

Then it gave an EPS forecast of 26.3 sen!

Fantastic! From losing money the last three years, Timberwell earnings is supposed to drop from the heavenly skies. The stock earnings for fy 2004, despite all the recent year losses, is projected to be 14.3 million or an earnings per share of 26.3 sen. Yes babe!

From zero EPS to a 26.3 sen EPS! WOW! Well done!

And then... of course... to spice it up... a DISCOUNTING CASH FLOW model is created for Timberwell.

All the right ingredients eh?

So here comes the trick question.

Is the TARGET PRICE important or what is more important is the reasoning why the stock deserves such TARGET PRICE?

Think about it... :P

On 11 March 2004, the stock opened at 4.16. Had a high of 4.18 and a low of 4.02. It closed at 4.06.

Ok... stop laughing.

Please.

The very next day.... err.... the stock.... PLUNGED!!!!!!!!!!!!!

No joke!

TWO TRADING DAYS later, the stock closed at 2.74!

From 4.16 to 2.74!

Holy moo moo cow!

Take a look!


And get this.

A year later, Feb 2005, if one takes a look at Timwell's quarterly earnings, Quarterly rpt on consolidated results for the financial period ended 31/12/2004, one would have realised that the FY 2003 final audited losses were adjusted to 5.95 million! And yeah, Timwell had losses for FY 2004 too! And it had losses for FY 2005 too!

Of course OSK has its Disclaimers nicely inserted back then!


  • The information in this report has been obtained from sources believed to be reliable. Its accuracy or completeness is not guaranteed and opinions are subject to change without notice. This report is for information only and not to be construed as a solicitation for contracts. We accept no liability for any direct or indirect loss arising from the use of this document. We, our associates, directors, employees may have an interest in the securities and/or companies mentioned herein.

Remember that.

Remember they accept no liability for any direct or indirect losses!

Of course they have since changed the wordings slightly.


  • All research is based on material compiled from data considered to be reliable at the time of writing. However, information and opinions expressed will be subject to change at short notice, and no part of this report is to be construed as an offer or solicitation of an offer to transact any securities or financial instruments whether referred to herein or otherwise. We do not accept any liability directly or indirectly that may arise from investment decision-making based on this report. The company, its directors, officers, employees and/or connected persons may periodically hold an interest and/or underwriting commitments in the securities mentioned.

So how?


Is the TARGET PRICE important or what is more important is the reasoning why the stock deserves such TARGET PRICE?

Of course, hackers would scream out loud!

Hindsight is simply story telling!

Here are some of the more recent ones.

Remember the JCY story? (Oops that passed a long time already yes?) 27th Aug 2010: Regarding JCY International


  • JCY earned some 207 million for its fy 2009. CIMB says times are good in 2010, so JCY should earn some 359 million! And 2011, JCY earnings will be even more super. JCY should earn some 441 million by then!

And JCY's Target Price of 2.68 was based on this projection. A projection that JCY should earn 441 million.

And the reality?


  • .... JCY's total 3 quarters so far is only 198.944 million. And to make matters worse, the earnings are declining each quarter. Would JCY even post a net earnings of 250 million for its fy 2010? I dunno. And what's CIMB's estimates again? 359 million for 2010 and 441 million for 2011!

Clearly, back in Aug 2010, one could clearly see that CIMB numbers were way too optimistic.

And sadly, JCY started missing... and the downgrade of earnings had to be made.... and with it ... the downgrade of Target Prices.

Do remember JCY has 2044 million shares!

Simple exercise for fun. Do you think JCY should trade at around 1.00?

Let's back track. For JCY to trade at 1.00 and at a PER of 12x (why 12x? Well that's what folks like CIMB had been using for JCY) JCY eps should be around 8.3 sen. And based on 2044 million shares, this would translate to an earnings of 169.652 million. Ok so far?

Is an earnings of 169.652 million possible for JCY?

JCY Q1 earnings is only 7.5 million only!!!! Can JCY's remaining 3 quarters earn some 162 million? Or an average of 54 million per quarter? From 7.5 million per quarter to 54 million per quarter?

Ok. How about a more recent example?

Take Perisai. Have you not heard people suggesting out loud that Perisai target price is 1.43?

Yes?

Did you hear that?

Why 1.43?

Cos the anaylsts said so!

:P

Seriously. Is the target price all that matters?

Or should one take the time and read how the anaylsts are reasoning why the stock is worth so much?

From this month's posting: Why Perisai Is Rated So High By The Local Analysts?

Let me paste what's written here again:

My comments: Again as stated before the potential is a mere USD25 per annum revenue. (revenue and not profit). I am also curious the statement 'NOT the same asset'. Look that asset is going to be 'refurbished' (Yes, going to be refurbished. The rig is not even fully converted yet! and yes, Perisai is buying a refurbished unit. A reconditioned unit.). So doesn't the 'refurbished' unit comes from the very same asset???

♦ Potential for upside. Our back-of-the-envelope calculation suggests net profit contribution from the charter to be around RM40-50m, vs. the FY10 reported net profit of RM10.3m and FY11 consensus net profit of RM30m (which excludes the Intan acquisition as well as this proposal). As this proposal is only expected to be completed in the 4Q11, the full-year impact would be in FY12, lifting the current consensus FY12 net profit estimate to around RM70-80m. Assuming 846m enlarged share capital, this suggests an FY12 EPS of 8.3-9.5 sen or a PER of 10.6x. Tentatively assuming a target PER of 15x, i.e. in line with our target for the market, this implies a fair value estimate of RM1.25-1.43/share.


My comments: RHB is now declaring that the NET PROFIT contribution from the charter works out to be RM 40-50 million and the very basis of their reasoning that Perisai should be worth around RM 1.25 to 1.43 per share.

Now that's their reasoning and based on their estimated earnings they reckon Perisai should be worth that high.

Simple question to ask is what if their estimate is way too optimistic?

Ah... why such a question?

Reasoning is simple also.

The higher the estimate the higher the assumed fair value is.

Yes?

From my flawed mindset, I would ask the following questions...

The obvious glaring thing for me is that Perisai's own comments is that Garuda is only giving them a USD 25 million revenue per annum. To be exact, let me paste again.


  • 9) The expected revenue of USD25 million is based on the bareboat charter to be entered between the Target Company and GEM.

Using a slightly higher USD exchange rate conversion of 3.1 to the Ringgit, this would be about rm 77.5 million expected revenue per annum.

And is 'expected' revenue only. Sometimes the figure can be lower.

Now what's RHB estimated PROFIT? Let me quote them again:


  • Our back-of-the-envelope calculation suggests net profit contribution from the charter to be around RM40-50m,

rm 40-50 million per annum??

Take the lower number, 40 million.

So RHB is saying from a revenue of 77.5 million, the net profit contribution should be at least 40 million????

WOW!

Isn't that an extremely profitable business?

But is the charter of a MOPU such a profitable business???

Is that possible?

Now the following document is posted by Perisai: PERISAI-announcement(290311).doc


  • The bareboat charter of MOPU business is a competitive industry, with other players operating in the Malaysian market. Competitive factors include price and quality of services as well as the quality and availability of MOPUs.

Those were Perisai's own words.

The bareboat charter of MOPU is a competitive industry!

If that's the case... how did RHB analyst come out with an estimate net profit contribution of at least rm 40 million??

Hey in terms of net profit margins, RHB is saying a net profit margin of 40/77.5 = 52%!!!!

A 52% net profit margin estimation when Perisai declared that "The bareboat charter of MOPU is a competitive industry"!

WOW! WOW! and WOW!

Think about that.

And the other silly question I would ask is if Garuda's earnings potential is good, ie 40-50 million per annum, why is Nagendram selling Garuda to Perisai for only 210 million????

How?

Think about it. Is RHB estimate way too optimistic?

What if.... Perisai's earnings from this charter business is only worth say 10 million per annum. Adding in Intan Offshore possible earnings contributions and Perisai's own business, perhaps a 40 million net earnings is pssible.

Now the problem with a 40 million estimate, based on an extremely enlarged new share base of 845.791 million shares, this would work out to an eps of only 5 sen per share!

And get this... if I use a 15x multiple on Perisai, this would equate to rough estimate of only 75 sen!

Ok. Of course that's a flawed simple thinking.

However, you can play around the numbers yourself. Yes, PLEASE DON'T USE MY FLAWED ESTIMATE OF 40 MILLION! :=)

You could use a net profit estimate of 50 million. This would equate to an eps of only 6 sen!

What about CIMB Research? Here's a snap shot.


    • Perisai is paying US$70m (RM210m) in cash and shares for Garuda Energy (L) Ltd, owner of a jack-up rig that is being converted into a MOPU, which will be supplied to an oil major. We estimate that Garuda will contribute RM40m p.a. to Perisai’s bottomline effective 4Q11. In view of this, we raise our EPS forecasts by 25.0% for FY11, 76.8% for FY12 and 67.6% for FY13.

    Same.

    CIMB also is using the estimate value of Rm 40 million!

    How?

    Ah.. perhaps their (RHB and CIMB) estimates are all spot on... and my posting is simply flawed!

    Yes, that is is very much possible but whatever it is, best you think about it.


    So how?

    Is the TARGET PRICE important or what is more important is the reasoning why the stock deserves such TARGET PRICE?

    Friday, April 15, 2011

    What Do You Look For In A Research Report?

    Here's a simple question, what do you look for in a research report?

    Do you hear folks moaning that the research report is written with a mission? And do you here folks moaning that they were duped into buy a stock just because of the seducing research report? But this is extremely subjective. The winners, those who made money in the stock, would argue that if not for the report, the stock would not have moved and if the stock did not move, they would not have made money.

    That's really so true and it could not been highlighted any better than the recent example. KN published the report when the stock was 63 sen on July 2010. And it gave it a target of 1.65.

    Buyers of stock around that price or even less than 70 sen, were laughing all the way to the bank. There is simply NO chance at all that they would come out and say that research reports are lousy!! Less than one month after the report the stock reached a high of 1.20+. It was marvelous. Sweetness! Heaven sent!

    On the other hand, stock chasers at the price above 1.10. Are they happy? How could they be? P&O fell to as low as 0.71 sen last month! ( Yeah the stock has recovered a bit and it last traded at 0.82 sen. They would not have been a happy camper cos they claimed that KN said the target price was 1.65! At 1.10 plus, they argued that there is still a chance that they could be rewarded. Curses!

    How?

    But incredibly, as you would notice, what's most important to the market and its players is HOW THE STOCK performed.

    Forget the reasoning. It doesn't matter. Yes, dump the reasoning!

    What matters MOST is how the stock reacts to the research report!!!!

    Seriously? That's the truth.

    Yes?

    Isn't that the sad truth?

    Nobody cares what the pen wrote. All everyone cares about is how powderful the pen is!!

    And all that matters for is how it had performed.

    It did not matter a bit that earnings performance was miles behind what the research report had insinuated. Yes, it did not matter that the company earned much less.

    And it certainly did not matter a single bit that the suggested possible takeover did NOT happen. (Some say, it could still happen! Me? LOL! I have no idea!)

    Yes, sadly it did not matter one single bit.

    What's most important is how the stock moved!

    So are research reports useless? Is this posting even useless? LOLOLOL!

    Ok, let's make the big ass out of you and me, and ASS-U-ME that it's not so.

    So what do you look for? Let me share some flawed thinking of mine.

    And oh, I do need to remind that I possess no power and certainly no magic powder. I own NO Voodoo Stick that can be used to move a stock up or down. Please get over it. If the stock moves up, don't blame. And if the stock thanks, err... Dec 25th is a long way from today.

    Ok, babe?

    1. THE DATE OF THE REPORT.

    Date of the reports are so important dude and dudettes!

    Reasoning is simple.

    Time changes. What is good back then might not be good today. And needless to say vice versa!

    So don't ever let an outdated report make a fool out of you and your money!

    Seioursly.

    Let me tell an old story told a couple of times before.

    it was in 2006 or is it 2005, a forum member emailed me and asked me about a stock pick. It appeared written in a 'local pro' manner. But I recognised the style of the writing. It belonged to OSK Research!

    And apparently there was this is so-called sifoo who recommended my friend to buy the stock.

    And one of classical reason used to buy the stock was that the stock was trading at a low PE multiple.

    But I knew INSTANTLY something was amiss for that said company was NOT doing well.

    I knew that for a fact cos of the earnings reported at Bursa website.

    But here it was, this so-called sifoo telling people the stock was BUY based on his LOW PE method.

    Which was a complete flawed set of reasoning because the stock was doing badly financially.

    And then... I noted....the DATE of the research report from OSK.

    It was OUTDATED!

    Incredible! That so-called LOW PE stock master, used an OUTDATED report to justify his LOW PE claim.

    And naturally the stock did poorly.

    Ya... low PE.

    So do note the date of the report. Relying on target price set on outdated reports could really, really make your money outdated too!

    2. IS THE RESEARCH HOUSE CONSISTENT ON THE STOCK RECENTLY?

    Are the reports consistent on the stock? Perhaps a past example would explain it clearly why this is important. 22nd July 2009, I posted Featured Report: OSK Research On Axiata Look at the end of the posting. It tracks the recent Recommendation history and price target for the stock.


    • 24th Dec 2008. Axiata 3.58. Maintain Neutral at 4.20.

    • 08th Jan 2009. Axiata 3.60. Maintain Neutral at 4.20.

    • 06th Feb 2009. Axiata 3.18. Maintain Neutral at 4.20.

    • 19th Feb 2009. Axiata 3.36. Maintain Neutral at 4.20.

    • 28th Feb 2009. Axiata 3.06. Maintain Neutral. TP lowered to 3.00.

    • 25th Mar 2009. Axiata 2.61. Take profit. Downgrade. TP lowered to 2.50.

    • 30th Mar 2009. Axiata 2.38. Upgrade to Neutral. TP at 2.50.

    • 28th Apr 2009. Axiata 2.10. Take profit. Downgrade. TP lowered to 1.73.

    • 20th May 2009. Axiata 2.32. Upgrade to trading buy! TP at 2.70.

    • 18th Jun 2009. Axiata 2.28. Trading buy maintained. TP at 2.70.

    • 08th Jul 2009. Axiata 2.42. Trading buy maintained. TP at 2.70.

    • 21st Jul 2009. Axiata 2.98. BUY upgrade. TP at 3.40.

    On Dec 2009, OSK reckoned that Axiata was worth 4.20. It had a neutral call on it. Come Feb 2009, Axiata was worth only 3.00! Yeah, it's call is neutral! (LOLOLOL!). Then in April, Axiata is even valued worst. The call was TAKE PROFIT! ( YEAH... this is where everyone should scream their lungs out and shout O-M-G !!! What profit was there to take? It was just in Dec OSK said the stock was a neutral with a fair value of 4.20. It's now April and its a bloody TAKE PROFIT with a fair value of 1.73? Look the screenshots. This was not made up!) And a month later, Axiata value suddenly jumped from 1.73 to 2.70!!!! ( O-M-G!!!! Exactly!)

    So how was that?

    Unreal yes?

    So I think it's good that we take a look at past recommendation history and price target for the stock. It's good to understand if the research house has been flip flopping heir recommendation on the stock. OSK example on Axiata is something we seriously want to avoid. That's junk. How could a stock value swing up and down in a 7 month period? Totally unreal!

    But... that's all the past.

    Can we have a real, present day example?

    Fair. Let's look at RHB take on IJM Land. The report was out YESTERDAY. First, a habit of mine is, I like to take a simple look at the current one year chart of the stock. Just a habit.


    The RHB report.


    The next two shows the previous two reports on IJM Land.

    How? What do you see?

    The recommendation is still the same. It's still an OUTPERFORM but the outperform target price is now lowered to 3.28.

    Sadly, RHB did not mention this (Target Price lowered) at all. And in fact what and how they said it was rather misleading (if you ask for my flawed opinion)


    • Reiterate Outperform. IJMLD is also our top pick besides Mah Sing. We maintain our Outperform call with a higher FV of RM3.28 (from RM3.18), at its RNAV/share, accounting for the higher GDV estimate for the Canal City land as well as a larger share base.

    The screenshot...

    Here's what RHB said on Feb 2011.


    Notice the difference? The 3.50 is based on 15% 10% PREMIUM to RNAV.


    And the interesting thing for me in RHB's report on IJM Land yesterday was the following.


    • Imminent conversion of RCULS – what’s the rationale? From our recent conversation with the management, we understand that the parent company IJM Corp will be converting its RM400m 10-year 3% RCULS soon. To recall, the RCULS arises from the reverse take-over (RTO) of RB Land in 2007, as part of the consideration. Post conversion, IJM Corp will have an additional 230m shares in IJMLD, raising its shareholding to 68-69%, from the current 61.6%. We are uncertain on the rationale of the conversion as this could be read positively or negatively. On a positive note, there could be some corporate exercise plan in the pipeline, such as privatisation of IJMLD given higher shareholding of the parent after conversion. On the other hand, the conversion of RCULS would result in dilution in earnings and shareholding of other shareholders. Barring any corporate exercise plan, we will not discount the possibility that IJM Corp may place out some shares subsequently so that its free float is kept at a reasonable level. Note that, our earnings forecasts for FY12-13 are adjusted for the larger share base as well as the interest savings on coupon payment (for the RCULS).

    Ooo... !!! IJM Land shares will see another increase of 230 million shares and these shares will be granted listing on Monday, 18th April 2011.


    • The longer-term picture. If it is not because of potential corporate exercise, we think investors may not like the parent’s upcoming move to convert the RCULS, as ROE, earnings and RNAV will be diluted over the short term. Having said that, we think the long-term positive earnings contribution from two upcoming big projects – Canal City and Sebana Cove, will be able to offset the impact when they come onstream from 2H2012. In fact, the higher GDV estimate from the Canal City is big enough to offset the impact of the larger share base arising from the RCULS conversion (shareholders’ equity is also adjusted) on RNAV. Our fair value, which is based on RNAV/share, is raised to RM3.28 (from RM3.18). Maintain Outperform.

    Yes, they no longer use a 10% premium and in fact, the RNAV is incredibly raised from 3.18 to 3.28!!

    Here's the screenshot.


    Now the interesting thing for me is the ENLARGED share base.

    Come Monday, including all the possible conversions of IJM Land warrants, the conversion of RCUL into shares will see IJM Land to have a share base of 1,560 million shares. In the earlier table from RHB's report on Feb 2011, IJM Land 'only' have 1,330 million shares.

    The 'possible' conversion of warrants.

    For the 'investors' who reckons that 'per share' is an important issue, then they should be aware of any possible dilution of 'per share' values. Simplicity? More means less share of the cake!

    If one clicks on Bursa website and take a peep on IJM historical announcements, this is what they will see.


    Now that's a fair bit of conversions, yes?

    So if one is an investor, surely one wants to account for all these conversion of warrants.

    Using the stock info from my stock quotes, this is the info on IJM Land.


    And this is the info on IJM Land warrants.


    Yes, present day, IJM Land 'only' have 1124 million shares and at present day, there are 205.8 million warrants. And warrants are constantly being converted to ordinary shares.

    And on Monday, another 229 million 'new' shares will be listed.

    That's a lot of conversion eh?

    Take RHB's estimate earnings for IJM Land. It excludes the 59 million, one time disposal gain. For 2011, RHB estimate that IJM Land should earn around 140 million. Using the new possible share base of 1560 million, IJM Land eps based on an earnings estimate of 140 million is only 9 sen eps. See the huge dilution in eps?


    How?

    Obviously, I could go on and on. I could be asking if the RNAV calculation is even fair etc etc but for this example, the additional listing of 229 million stocks is a massive issue. Dilution of per share value would be significant.