Here is a snippet from a news posted on the Star newspaper yesterday.
- KUALA LUMPUR: Former Singapore prime minister Goh Chok Tong had, in 2002, expressed his support for a bridge to replace the Causeway.
In a letter to Tun Dr Mahathir Mohamad on April 11, he said:
“Between the new bridge to replace the entire Causeway, and one to replace just the Malaysian side of the Causeway, I like the former better.
Just imagine if that news report was made in the following.
- KUALA LUMPUR: It is believed that Former Singapore prime minister Goh Chok Tong had, in 2002, expressed his support for a bridge to replace the Causeway.
According to sources, a letter was send to Tun Dr Mahathir Mohamad on April 11, and it was understood that he said:
“Between the new bridge to replace the entire Causeway, and one to replace just the Malaysian side of the Causeway, I like the former better.
How?
Do you reckon that such news reporting is acceptable?
It is believed.
Yeah dude.... just who is believing what?
And according to sources. What sources? The Ah Pek could be a source. The Ah So could also be a source. The Mak Cik at the cafeteria could also be a source. The guy in the toilet could also be a source. So could the jaga kereta boy, he too could be a source!
How? If it is not acceptable in our daily news, why is it then acceptable in our financial news?
Now when we reads in the financial news the phrase according to sources, shouldn't we realise that such financial reporting simply isn't acceptable. And worse still, there are some who are willing to take a punt in the market based on such reporting.
Yup, does it make sense to put money at risk based on reports when the sources could be anyone?!
So who is them sources?
Do they really exist or....
Or perhaps it could even be Ms. Maggie and her famous sauces.
Now is it logical that the market is made and dictated by this infamous Ms.Maggie?
Flashback...... Feb 12 2005.
- Tradewinds breaks six-year losing streak
BY JOSE BARROCK
TRADEWINDS Corp Bhd (formerly known as Pernas International Holdings Bhd), it is believed, will report profits of about RM100mil for FY04. This represents a marked improvement, breaking a six-year losing streak.
( it is believed?? Hmm.. is this wonderful financial reporting or what??? )
The company is expected to announce its results at the end of the month.
“Tradewinds (Corp) has turned around significantly. It made about RM100mil profit after incurring losses last year. Debt too has been slashed considerably,” says a source.
(Ahhh.... ladies and gentleman... pak cik and mak cik.... ah pek and ah so.... introducing...... Ms.Maggie and her Sauce!!!...... now Tradewinds in only expected to announce its earnings at the end of the month.... soooooo.... why and how can this Ms.Maggie is so resourceful that she knew that Tradewinds MADE ABOUT rm100 mil profit? Ahemm... either way... how can? If it is true... then issit insider info ka? If false... then... pure financial gossiping??? )
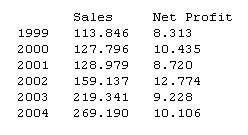
For the financial year ended December 2003, Tradewinds Corp suffered a net loss of RM73.7mil from RM1.1bil in sales. But the signs of improvement were already evident from the first nine months performance of the company. For the nine months ended September 2004, the company - largely involved in the hotel business, property development and plantations - posted a net profit of RM54.2mil on the back of RM938.5mil in revenue.
Sources say both the plantations and sugar businesses have lent a boost to the company’s earnings. (This one chili sauce kah or sweet sour sauce?)
Tradewinds Corp controls as much as 53% of Tradewinds (Malaysia) Bhd, a company that owns Central Sugar Refinery Sdn Bhd, which controls as much as 40% of Malaysia’s RM1.5bil sugar market.
In the future, more can be expected from Tradewinds Malaysia as the company just strengthened its position in the sugar business via the acquisition of Gula Padang Terap Sdn Bhd, from among others Tan Sri Robert Kuok Hock Nien’s PPB Group Bhd, for RM188mil.
Tradewinds Corp’s hotel business, it is understood has just about broken even, but the prospects seem promising. “There are a lot of improvements ... some of the loss-making hotels have turned around. The Mutiara Pedu (Golf and Lake Resort) in Kedah and the Hilton Batang Ai (Longhouse Resort in Sarawak) have also made progress, things are looking better for the group,” the source adds. The two hotels were previously up for sale with a price tag of around RM100mil. (Elo world... what is being understood here? huh? .... and gee.... I wonder what sauce did Ms. Maggie add? Black sauce kah? Or issit oyster sauce?)
Tradewinds Corp has managed to cut its debt from RM2.5bil in 2003 to the region of RM1.2bil now which will undoubtedly reduce its finance cost burden.
Year to date, Tradewinds shares have gained 11 sen, having reached a 52-week high of 78.5 sen in late January this year. The counter ended trading on Tuesday at 76 sen.
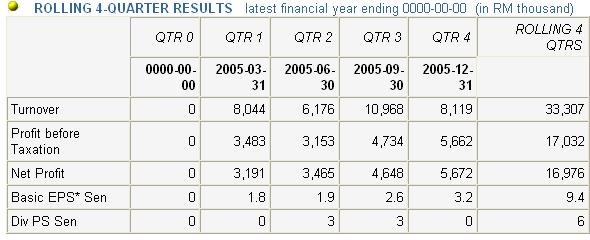
Let's do some digging. Tradewinds last reported quarterly earnings was on 30th Nov 2004. And this is what the company management said in its notes.
- But the signs of improvement were already evident from the first nine months performance of the company. For the nine months ended September 2004, the company - largely involved in the hotel business, property development and plantations - posted a net profit of RM54.2mil on the back of RM938.5mil in revenue.
Hmm... so TWSCorp has indeed managed to post a net profit of 54.2 mil, but this is not that accurate as this earnings performance was aided by an extra-ordinary gain of 25.991 mil as stated in TWS financial report.
Anyway.... one just gotta wonder.... Tradewinds first 3 quarters net profit only totals 54.2 million.
So this incredible Ms. Maggie is suggesting that Tradewinds makes a whopping net profit of 100 million for its current fiscal year.... which means Tradewinds will make a whopping 45.8 million (100 -54.2 ) for the last quarter of the year. (ahhh... would it be wrong for me to suggest that ze whopping huge profit is used as a catalyst to seduce punters to whack this bugger stock up?)
Well.... that's pretty optimistic if you ask me!
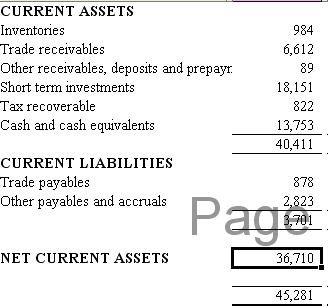
- Tradewinds Corp has managed to cut its debt from RM2.5bil in 2003 to the region of RM1.2bil now which will undoubtedly reduce its finance cost burden.
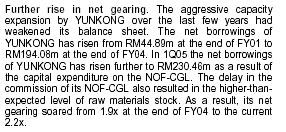
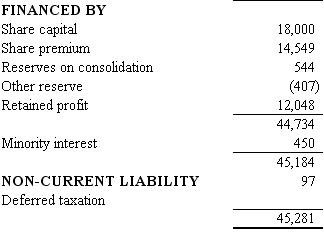
Debts only 1.2 billion? Errr.... correct ka? Here is the snapshot of Tradewinds balance sheet then.

Hmmm.... if my eyes do not fail me...it states that Tradewinds short term borrowings is some 873 million. Bonds and Long term borrowings is at 1.021 billion. Which means total debts totals some 1.894 million.
So I really wonder if this is a simple innocent reporting mistake.
Or perhaps this is ze handywork of Ms. Maggie?!
Doesn't one wonder how and what sauce Ms. Maggie used to cook the following statement: Tradewinds Corp has managed to cut its debt from RM2.5bil in 2003 to the region of RM1.2bil now which will undoubtedly reduce its finance cost burden.
How?
Anywayyyyy....... Tradewinds announced its 2004 Q4 quarterly earnings on 25th Feb 2005...
And how did Tradewinds do? It lost 1.746 million for its 2004 Q4 earnings. Ahem!!
And only ended its fiscal year making some 52.504 million.
And 52.504 million is a huge cry from a profit of 100 million as suggested by the reporter and Ms. Maggie!!!!!
And now comes the very interesting point.
AHem....
On 25th Feb 2006, the Star had a news clip stating the following:
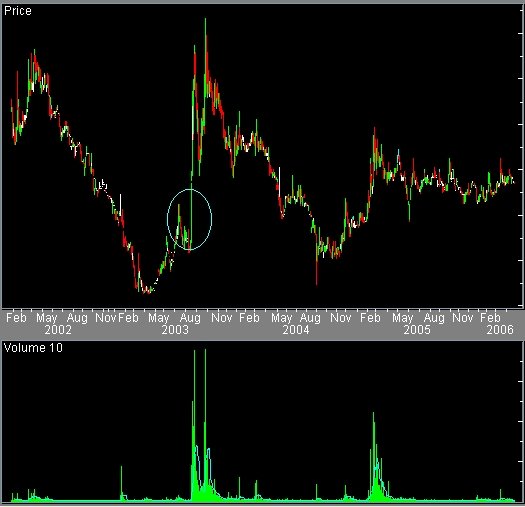
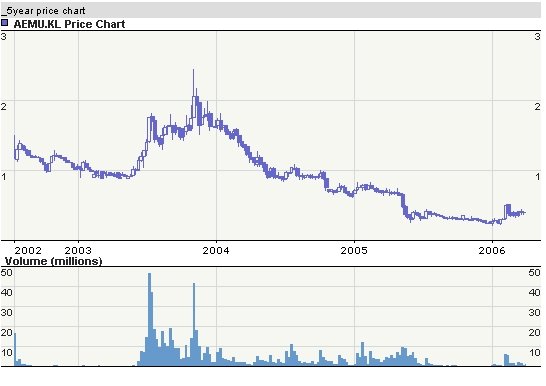
- Tradewinds shares have been trading below par value of RM1 for almost three years. The company’s stock hit a 52-week high of 80.5 sen on Feb 14 this year, after touching its low of 43 sen on Aug 20, 2004. It closed at 63 sen on Thursday.
Do you know what is so interesting about that above statement in red?
Well Jose Barrock wrote that article on Saturday, Feb 12th... now check this out.... before that incredible Ms.Maggie and her sauce article was written... TWSCorp (Tradewinds) was a stock trading around the 77 sen.. and the minute Ms. Maggie showed up... TWSCorp went zoom, zooming up some 4.8% on Feb 14th.
What an incredible lovely Valentine present from Ms. Maggie to the market!!!
Anywayyyyyyyyyyyyyyyy....... after TWScorp hitting a 52-week high on the next trading day, Feb 14th 2005...... 8 trading days later... on Feb 24th, TWSCorp closed at 63 sen!!!!
Well... doesn't it sound like Jack went up the hill sooooo fast that Jack came tumbling down there after?!
Sooooo...... see how great and POWDERful Ms.Maggie and her sauce is?
Just splatter the business news article with all the according to Ms.Maggie or her sauces.... and watch the wonderful chain effect(s) on the stock!
(ahh... sometimes.... this Ms.Maggie is soooooo unpredictable.... sometimes she gives ze market sweet sauce... but sometimes... it is sweet and sour.... and sometimes it is red hot chili sauce!... ho ho ho!!!)
Now..... aren't we soooooooooooooooo proud of our financial news?
I am!
But then... there are many who just would not agree and could not even be bothered with what I am saying here... most important... the report says no bad about their vested stocks! Sad isn't it?