On today's Business Times,
- Privatisation, delistings may take RM28b off mart
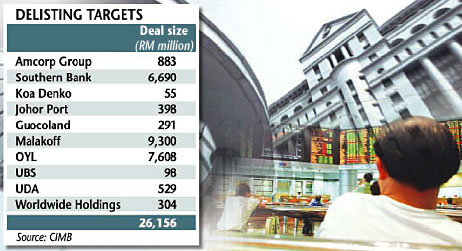
Some RM26 billion in cash will fall in the hands of minority shareholders if the privatisation and delisting deals announced in 2006 are completed, CIMB says
- "It's not true that these delistings are bad for the equity markets. If anything, I think it is quite a healthy trend," said Christopher Chan, head of the investment banking unit of CIMB Group.
A healthy trend?
Gosh!!!!
firstly, I wrote on this delisting or privatisation issues before. ( see Privatisation Issues )
- The issue of privatisation and the subsequent delisting of a listed subsidiary.
Generally there are two ways companies can be delisted from a stock exchange in.
The first case is the enforced, compulsory delisting of a company, in which the stock exchange forces the delisting of the stock because the listed company has failed to comply with the stock exchange listed requirements. And these are usually based on commercial reasons in which the listed companies simply cannot operate in a profitable manner.
The second manner a company can be delisted from a stock is where the company voluntary informs the exchange that they no longer want to be listed. And a variation of this case, is the delisting of a listed subsidiary is made by its holding company, in which the minority shareholder of the listed company is forced to choose between the offered compensation price or risk being involved in a private company, which would ultimately offers no transparency rights.
I have no problem at all with the first case. These are them koyak companies. Chap-lap companies which are losing money like crazy.
The second one, the privatisation and the subsequent delisting of the listed subsidiary, this one i really dun like at all.
It's just totally unfair to the minority shareholder and it makes a total mockery of the whole stock exchange.
Listed Companies should not be given the approval so easily to privatise their listed subsidiary company in which the general investing public is forced or threatened with the issue of delisting. And as mentioned earlier once the company is delisted this offers the investor no transparency rights at all. So when a listed company is able to list and delist their subsidiary companies as per their whimps and fancy this would make a total mockery of the stock exchange.
And what about the general offer price for the minority shareholders stake in that listed company? Would the minority shareholders get an offer that is fair or would the minority shareholder be placed in a disadvantage position? Would the premium offered over the existing share price to adequately compensate the minority investors?
If no, this ultimately means that the minority investors would never be given a chance to being adequately compensated for the permanent withdrawal of a good investment opportunity.
And if this is the case, then this would contradict the government's plan to woo more investors into Bursa Malaysia cause investing would have indeed turned very unattractive, a game which is very biased against the investing public. ( see also: Privatisation Issues: MetroJaya )
The news article continued by saying:
- "Chances are minority shareholders will re-invest in the stock market if they had made money from delistings," he said at the National Mergers & Acquisitions (M&A) Conference in Kuala Lumpur yesterday.
Oh yes, there was probably some money made from delisting.
But is this a JUST offer?
Offering say 3.00 for something that is worth 8.00, just because it was trading at 2.00 does mean that money is made ....
BUT again is the offer JUST?
Fair for speculators/traders trading/punting into the stock. They made a nice profit.
But do not forget the minority shareholders/investors exist too!
Remember the market needs speculator just as it needs the minority shareholders.
If the minority shareholders keep getting short-changed like this, and if this keeps happening, will there be any more minority shareholders in the future? The market needs the minority shareholders. These are the ones holding on to their shares during good times and more important, during bad times. If all minority shareholders thinks that this is a rotten game, what's left? Who wants to play in an unfair game?
In my opinions, it's a crying shame because the money offered is worth peanuts. Lollipops.
Flip it around.
Think.
These general offer is made when there there is a privatisation exercise. An offer to buy shares from the minority shareholders.
A business offer if you would say.
Since this is a business offer, to buy the shares, why must the minority shareholders sell at a discount?
And worse still, why sell at a discount?
And worse still, why sell at such a HUGE discount?
Does anyone does such business practise logically?
And to make it worse, take the 2.00, 3.00, 8.00 into perspective.
So the share is only trading at 2.00. If a GO is made for this share at 3.00 which offers a nice reward of 50%, is the GO offer fair when we know the share should be worth 8.00?
Dare say fair?
And if this continues, who wants to invest in the share market anymore?
And to take the matter worse, these comments are coming from an investment bank that is so involved in privatisation deals. Take this snippet from a recent Business Times article on Worldwide. Note how CIMB is playing an active part.
- The proposed exercise is not a conventional general offer (GO), but a scheme of arrangement (SOA) to be implemented under Section 176 of the Companies Act, 1965.
Under the exercise, PKNS-Federal Furniture International (M) Sdn Bhd, a wholly owned subsidiary of PKNS, will be the special purpose vehicle (SPV) that will Worldwide private.
First, PKNS will inject its 51.03% stake in Worldwide into the SPV, which would then offer RM3.50 cash to acquire all the remaining shares in the company.
The purchase of the rest of the shares is estimated to cost about RM300mil.
CIMB SI Sdn Bhd will subscribe to RM75mil redeemable preference shares in the SPV as part of the financing arrangement for the SOA.