Dedicated to farnaway:
Using the same stimulation done by Wallstraits on GHL.
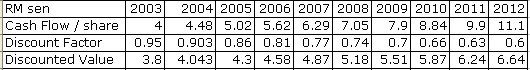
First of all here is Wallstraits table again.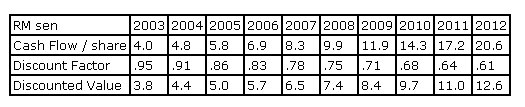
And here is their interpretation of the table:
- Given these assumptions (you may want to recalculate this simulation using your own cash flow, growth and discount rate assumptions), GHL’s intrinsic business value based on discounted cash flow expected to be produced from 2003 to 2012 is RM 74.5, which is approximately a 72% discount to the current market share price of around RM 0.21.
And from a Price earnings perspective, this is what Wallstraits had to say...
- If GHL does achieve cash flow per share of 8.3 sen in 2007 (5-years forward), and at that time GHL is valued by the market at 10-times cash flow, the share price would need to appreciate from 21 sen today to 83 sen, or an appreciation of nearly 300% in 5-years. Of course, GHL has only been listed on Mesdaq for a month, so our assumptions will likely need refinement as the quarters and years pass.
now GHL latest quarterly earnings announced in Feb saw it reporting a net profit of 11.656 million. Depreciation was reported to be 6.368 million. Giving GHL a free cash flow of 18.024 million. And if one continued to use Wallstrait numbers, ie number of GHL shares at 250 million, this would equate to a free cash flow of 7.2 sen. And what was Wallstraits numbers? 5.8 sen. How?
And to complicate matters, GHL had a series of 1 for 4 bonus issue and also a 3 for 5 rights issue. All in which bloated the current number of shares to 551.480 million shares. And based on the enlarged share base, GHL free cash flow should be 3.3 sen for its fiscal year 2005.
Now, if i redo the whole table... using 10 million as the starting total cash flow and based on 551.480 million shares, the starting cash flow should be 1.8 sen.
And here is how the table should look like.

Let's look at the 2005 results. The stimulation showed cash flow per share to be at 2.59 sen. Actual? 3.3 sen.
Here's more intresting stuff... create a same table under Excel and play with some numbers...
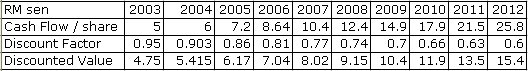
The above was set using the initial cash flow at 5 sen. End result? total discounted cash flow f rom 2003 to 2012 would work out to 91.85 sen. (compare to 74.5). And at 2007, total cash flow is at 10.4 sen. (compare to wallstraits 8.3 sen).
Now let me change the starting point to 3 sen. And the below is the end result.
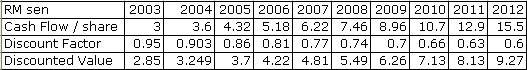
Total cash flow from 2003 to 2012 equals 55.11 (compare t0 74.5 sen) and 2007 cash flow per share is at 6.22 sen (compare to 8,3 sen). See how much difference it makes by changing the starting terminal point?
Ok. How about changing the annual growth rate? remember Wallstraits used 20% per annum.
Here is how the table would look like using a 25% growth rate and using 4 sen as the intial starting point.
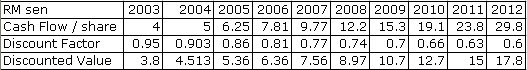
The total discounted cash flow from 2003 to 2012 would now total 92.74 (compare to 74.5) and 2007 cash flow would equal 9.77 sen (compare to 8.3 sen)
Or how about just a 12% per annum growth rate instead of 20%?
End result? Total discounted cash flow would now total 51.03 sen (compare to 74.5) and 2007 cash flow per share is only 6.29 sen (compare to 8.3 sen)
See how complicated things get?
Ahhh... I could continue by changing the discounted factor... and the end result would differ greatly.
Hope this posting helps!
Cheers!


4 comments:
whoaa moola!
an entire mumbling dedicated to me. i feel so honoured, thanks! so thoughtful of you.
The info is super helpful, at least i get an idea how to go about projecting and getting a discount rate. and the links to wallstraits were great too. Now i can put it into practice and real life examples. hope it works for me. thanks moola.
anyway, i do haf a few concerns with the above mumbling.
1. the discount rate used was interest rate. I do feel that's a tad too small. i would feel that my personal required rate of return is definitely much higher than the current say, FD interest rate or even the BLR. Can i apply my own "pluck from the sky" interest rate?
2. i heard about WACC. Is this v complicated to use? i'm not sure where to find the risk premium, beta etc etc components of the WACC. Any thoughts on this?
thanks again moola. Still digesting ur mumbling...new ma.
whoops sorry, moola,
didn't read the one dedicated to farnaway before i typed my previous comment.
I can see now that the assumptions made including the discount rate to be used is entirely up to individual and can give a very wide range of values....hmmmmmm hmmmmmm
So how? what methods to you use to value a stock moola?
Hi,
The discount rate used should be preferly be alternative return of your money, in which the FD rates would be an ideal alternative comparison.
Weighted average cost of capital?
Err...sorry i do not follow this at all...
Thanks! Moola, for dedicating this section to me. I have read through the last three articles you wrote and the associated comments, now I understand where you are coming from. I guess there are just too many assumptions and variables for me to use DCF in my valuation of stocks.
Anyway, have been reading your blog for the past three months. did go through some of your archives as well. I must say that your blog is a treasure chest for new investor like me to understand the way to analyse the financial statement of a company as well as how to smell for anything fishy in the company.
Look forward to more interesting articles from you.
Post a Comment