Saturday, July 31, 2010

Regarding P&O: The Stock That Flew Into Orbit

Saw the following article on Star Business: Prudential UK eyes P&O takeover

Now before I read what the article was saying, I was aware that K&N had dona a stock analysis (initiated coverage) on the stock back on 22nd July 2010 and I was well aware that the stock literally flew into the orbit.

Yeah... you know and I know... if you are reading this right now... LOL!... you are rather LATE into the party.

Don't believe?

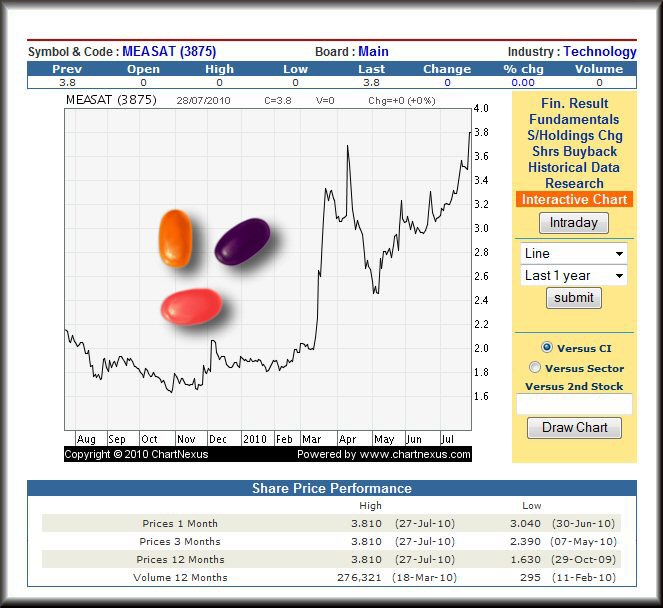
Think I am being nasty and so black hearted and I am attempting to stop you from seeking next week's fortunes in the stock market? Well take a look...


The stock was just 0.585 sen on 21 Jul 2010. The stock last traded at 0.925 on Friday. (ps: K&N initiated coverage on P&O when the stock was trading at 63 sen. Target price stated was 1.65!! :D)

And so after the stock is well into orbit, the local media is only promoting the stock now.

How?

Could it go much higher?

And how high?

:D

I then proceeded to read what the mighty pen from our local press has to write...

  • PETALING JAYA: Prudential UK is believed to have submitted an application to Bank Negara to commence talks on the potential acquisition of local general insurance company, Pacific & Orient Bhd (P&O).

    However, the details of the potential merger and acquisition (M&A) exercise between the two parties were still unclear....

'Is believed'? LOL! Who is believing this? And yeah... details of the M&A is... STILL UNCLEAR!

LOL!

  • This has added fuel to recent market talk that P&O had emerged on the radar of potential buyers.

Well? This Star 'financial' news article is sure adding the fuel! :D

  • According to Kenanga Research, the owner was contemplating a divestment in P&O in a deal that could reap proceeds that were well above P&O’s implied stock market valuations.

    Chan Thye Seng, the managing director and chief executive officer of P&O, holds a 51.4% stake in the company.

    When contacted, P&O declined to comment on the matter.

    When contacted, a spokesperson from Prudential Malaysia said it did not comment on market speculation.

Ah.. the K&N article ( let's see that later ) ... but ... how ironic... here we have a stock that is flying off into the orbit... and the two parties speculated to be involved in a M&A is declining to comment on the..... market speculation.

LOL!

  • “Having undergone a massive change in business direction over the last two years, P&O has engineered a major turnaround in profitability,” said Kenanga in a recent report.
    P&O returned to the black in the previous financial year ended Sept 30, 2009, with a net profit of RM14.9mil compared with a net loss of RM32.6mil the year before.

    But, for the first six months of the current financial year, P&O slipped back into the red with a net loss of RM1.4mil compared with a net loss of RM6.1mil in the previous corresponding period.

Ah... A turnaround stock... but ... but... but... it's conflicting... :P

Look at what K&N is saying... 2008 it was losing money.. 2009 it returned to the black.. BUT.. the first half of the year... P&O is losing money again.

How would you define it?

Me?

I see a possible turnaround.. but...with P&O losing money again the first half of the current fiscal year.. I reckon it would be best that I not used that word 'turnaround'... and I would certainly not boldly call it 'a “ major turnaround in profitability” like how K&N did.

  • As at March 30, 2010, its net asset per share was RM1.34.
    P&O’s main focus is on two core areas – financial services and information technology (IT).

Huhu!

Net asset per share was rm 1.34 as at 30th March 2010?? LOL! K&N Target price is 1.65! More than the net asset per share! No wonder this stock is so 'powderful' the past couple of days. :D

(ps: buy on rumours? Sell on news? :P )

Time to dig out that K&N report... (ps: this is a 15 page report. The longer the better eh? :P )


  • Extremely cheap valuations. P&O is trading at 3x FY11 PER and 0.55x P/BV. There could be upside to our profit forecasts as our investment assumptions of 2.5% Fixed Deposit yields are fairly prudent to account for its RM900m near cash holding.

Huhu!

rm900 million near cash holding??????

Where are all the 'value investors'?

Time to check out some announcements on Bursa website.. ( ahh.. recently.. a stock split Entitlement - Others )

Here's P&O quarterly earnings reported in May 2010: Quarterly rpt on consolidated results for the financial period ended 31/3/2010

Here's a screenshot of its balance sheet asset...


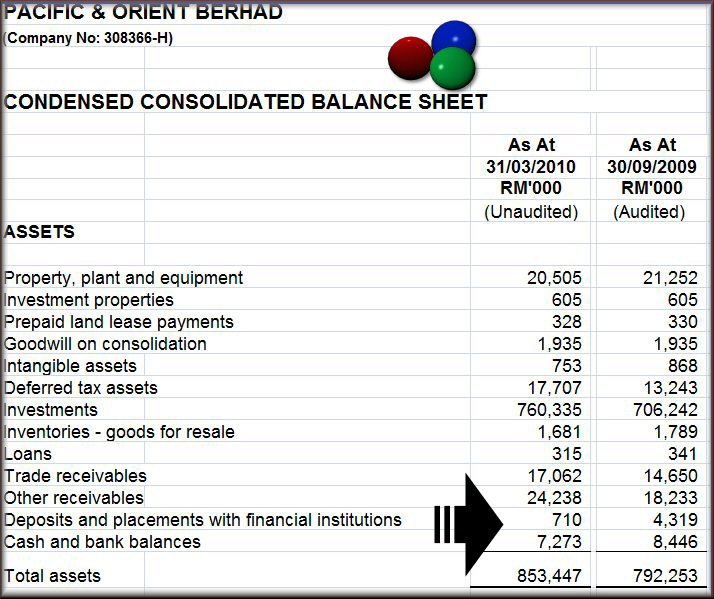
hmm.. maybe I cannot understand K&N's statement "There could be upside to our profit forecasts as our investment assumptions of 2.5% Fixed Deposit yields are fairly prudent to account for its RM900m near cash holding." since I cannot find where the 900 million...

Let's look at the extremely 'cheap' reasoning from K&N again.

  • Extremely cheap valuations. P&O is trading at 3x FY11 PER and 0.55x P/BV

Now... let me say again... of course I believe that a company should be valued based on what it can earn in the future. Yes... future earnings are very important...

But... but.... this is where it gets tricky.. and this is where the investing public can be fed with the incredible sky high earnings estimates... which inadvertently does make a stock appear extremely cheap. :P

Here's K&N estimates...

You need to click on the image to see a clearer and bigger view. :D

Anyway.. from the table... KN said P&O is projected to earn some 32.87 million for this current fiscal year 2010.

Well.. remember the Star Business article earlier? K&N acknowledged that for the first half of the current fiscal year, P&O have a current net lost of 1.4 million.

Now let's look at P&O announcements on Bursa website.

  1. May 2010: Quarterly rpt on consolidated results for the financial period ended 31/3/2010 - P&O made 3.247 million for the quarter. - Current half year losses were 1.417 million. (as stated by K&N)
  2. Feb 2010: Quarterly rpt on consolidated results for the financial period ended 31/12/2009 - P&O stated it lost 21.352 million for the quarter!

Now this is where I am so lost ( Yeah.. what to do since I am not an accounting expert. :P ) and confused. Q1 in Feb 2010, P&O said it lost some 21.352 million. Q2 it said it made some 3.247 million. But.. it's half year total losses was only 1.417 million.

Me? I am so lost. :P

Anway... here's a couple more quarterly earnings from P&O.

  1. Nov 2009: Quarterly rpt on consolidated results for the financial period ended 30/9/2009
  2. Aug 2009: Quarterly rpt on consolidated results for the financial period ended 30/6/2009

Now using the current 2010 half year net loss of reference, K&N had estimated P&O earnings for fy 2010 to be 32.87 million.

Now I know, earnings projections and estimates, are incredibly difficult. More so for me, since I am not a Sotong. :P

But... an earnings estimates of 32.87 million when the company is sitting on half year losses of 1.4 million???

Surely that's a bit too optimistic, yes?

yeah... from K&N earnings estimate table.. we see K&N using a PAT (profit after tax) growth estimate of 120%!!!

a 120% growth estimate!

huhu!

Rather incredible eh? Considering the fact P&O made 14.9 million and current half year it is losing 1.4 million. But yet, K&N states it can achieve an earnings growth of 120%!!!

huhu!

But... KN did NOT say P&O is cheap based on 2010 figures!

Instead K&N states P&O is cheap based on 2011 figures!

And what is K&N earning estimates for P&O again? 43.47 million!!!!

huhu!

Wiki Wiki!

And as stated in the earnings estimate table... this is an PAT growth estimate of 32%!

How?

Yeah babe. K&N is saying P&O is cheap based on this 2011 earnings. Only trading at 3x PE multiple based on 2011 earnings!!!

I just love how they do it.

:D

K&N report continues...


  • 92% upside to base case valuation of RM 1.15. This values the group at an undemanding FY11 PER of 6x, which is at the low end of the 6-15x 2010/11 PER of Malaysian general insurers.
  • M&As valuation of RM 1.65 (translating to 4.2x). Although there is already substantial price upside to our base case valuation, the stock is worth even more on M&As basis. Our M&As values P&O’s in range of 1.5-2.0x FY11 P/B V, which is in comparison with first phase consolidation of Malaysian banking sector.

waa.... two type of valuations. Base case valuation of rm 1.15 and M&A valuation of rm 1.65!

Terror la!

:P

Then I reminded myself that K&N report is a 15 page report! oO

Do I want to go thru it all?

Nah....

so how?

Would P&O continue its fly up, up and away?

Seriously? I do not know.

----------------

ADDUM:

regarding the 900 million near cash holding... on page 10 of the report.

  • Investment Gain. However, in view of the group’s potential earnings volatility, we have factored in some prudent investment yield assumptions in our forecasts.

    For example, the yield for the group’s investment portfolio could be higher than we have assumed of 2.4% which attached to only 6-months Fixed Deposit rates. Its RM900m near cash/ all cash position, may generate bigger profits if increase equity exposure in any market dips rather than the small profit that we are projecting. In addition, our projected rise 2.4% yield to its RM900m cash for FY11 could prove conservative, as it is slightly lower than market expectation.

Hmm... let me look at May's earnings again: Quarterly rpt on consolidated results for the financial period ended 31/3/2010


How?

Oh.. ps: P&O does do some money lending business too. :P

  • Pursuant to paragraph 8.23(2)(e) of the Main Market Listing Requirements of Bursa Malaysia Securities Berhad, the Company wishes to announce the moneylending activities (as part of the ordinary course of business) of its wholly-owned subsidiary, P & O Capital Sdn Bhd for the second quarter ended 31 March 2010, as set out in the attachment.

    POB~POC (2Q 2010).doc

Friday, July 30, 2010

Update On Gadang Holdings

Just saw the followings news flash.

  • Gadang advances as Q4 income triples

    Published: 2010/07/30

    Gadang Holdings Bhd, a Malaysian construction and property developer, rose to its highest level in more than three months in Kuala Lumpur trading after saying
    fourth-quarter net income more than tripled from a year earlier.

    The stock advanced 3.2 per cent to 98 sen at 9:39 am local time, headed for its highest close since April 7. -- Bloomberg

Here's the link to Gadang's earnings (note: it's a temp link only. Don't ask me why, go ask Bursa. :P ) Quarterly rpt on ceonsolidated results for the financial period ended 31/5/2010

Now I have blogged on Gadang Holdings a couple of times before. See Update On Gadang Holdings

Here's my updated summary table on Gadang Holdings.

How?

As stated in the blog posting
Update On Gadang Holdings
  • As you can see Gadang's earnings had been dismal. It fared terribly in 2008 and 2009.

And surely any comparison against those two years would make the comparison look super good, yes?

However... having said that... I have to acknowledge that 2010 has been a good year for Gadang. A net earnings of 15.060 million is indeed impressive considered what Gadang has ever done.

Since 28th April 2010, Americans Pulled USD 42.116 Billion Out From Equities!

So how has the S&P performed for the current month of July?


Now that's rather impressive right? (except for the lack of volume :P )

Now I have been posting recently on out from US Equities. :P

July 9th: And The Stock Markets Rallied... Because Of....

  • Equity funds had estimated outflows of $180 million for the week, compared to estimated outflows of $1.28 billion in the previous week. Domestic equity funds had estimated outflows of $227 million, while estimated inflows to foreign equity funds were $47 million.

July 16th: The Markets And Fund Flows

  • Equity funds had estimated outflows of $4.23 billion for the week, compared to estimated outflows of $216 million in the previous week. Domestic equity funds had estimated outflows of $4.12 billion, while estimated outflows from foreign equity funds were $112 million.

July 22nd: And The Money Keeps Flowing Out From US Equities

  • Equity funds had estimated outflows of $3.27 billion for the week, compared to estimated outflows of $4.29 billion in the previous week. Domestic equity funds had estimated outflows of $3.16 billion, while estimated outflows from foreign equity funds were $113 million.

Now surely... the Amercians can see that the S&P is going up higher and higher yes?

And despite the markets going up higher, they continued to take out money from the US equities!

Wassap?

Is there a plague with the US equities?

And here's the latest update, for the period ending 21 July 2010:

  • Equity funds had estimated outflows of $1.32 billion for the week, compared to estimated outflows of $3.19 billion in the previous week. Domestic equity funds had estimated outflows of $1.53 billion, while estimated inflows to foreign equity funds were $204 million.

Now if I compile the recent data...


Now don't let me scare you but let's have a rational look at the data itself. (data source: here )

Well the week prior to 5th May was 28th April and since 28th April 2010, Americans took out a whopping 42.116 Billion out from the US Equities!

Why?

No more love for the US Equities markets?

I dunno....

ps... at this rate... it's no wonder... in regards the lack of volume in the market. LOL!

Thursday, July 29, 2010

Possible Problems From Fitch's Downgrade Of Vietnam?

The Vietnam stock market has NOT been doing well this year.

Yesterday:
VN Index deeply declines to 491pts

  • The VN Index suddenly dropped during July 28 session, causing worries among the stock investors. Going against the uptrend of the global stock markets, the domestic stocks seemed to show no care to the movements of foreign stock exchanges.

    After the statement released by State Bank of Vietnam about maintaining the basic interest rates of 8 percent per year, it was considered as the mainstay of the market during the time the market showed no impacts to the released information sources.

    At closing time, the VN Index sharply slumped by 6.67 points or 1.34 percent to end at 491 points with the total matching order trade of over 39.6 million shares worth 1.136 trillion dong in value.

The following chart shows the performance of the VN Index this year to date.


And not helping is the news that Flitch has downgraded Vietnam Ratings!

On WSJ:
Fitch Cuts Vietnam Ratings
  • By ARRAN SCOTT
    Fitch Ratings cut Vietnam's credit rating Thursday, citing a deterioration in its finances and a banking system increasingly vulnerable to systemic stress, and warned that the country could face economic and financial instability ahead.

    The ratings firm also slammed the country for
    poor management of its macroeconomic policies.

    "Vietnam's track record of stop-go policy tightening and easing has been ad-hoc, reactive and inconsistent," said Ai Ling Ngiam, director in Fitch's Asia Sovereign team.

    Fitch downgraded Vietnam's long-term foreign and local currency ratings to B+ from BB-. The outlooks on those ratings are stable. Fitch also cut Vietnam's Country Ceiling to B+ from BB- and affirmed the short-term foreign currency rating at B.

    Mrs. Ngiam said Vietnam's weaker external finances and rising external financing requirements amid an inconsistent macroeconomic policy framework, a highly dollarized economy and a weak banking system were behind the rating downgrade. Fitch also noted that while Vietnam's foreign exchange reserves increased in the second quarter, it doesn't believe the country's external finance position has stabilized yet.

    The ratings firm said net long-term capitals flows, including direct and portfolio investment, may fall short of covering Vietnam's current account deficit for a third straight year.
    Fitch estimates the deficit will amount to more than 10% of GDP in 2010.

    Fitch said the repatriation of external assets by state-owned firms suggests that the rise in foreign exchange reserves so far this year may not be sustainable. It forecasts Vietnam's gross external financing requirements will increase to 79% of forex reserves in 2010 from 37% in 2009, higher than the median of 55% for "B" ratings. "This would increase Vietnam's vulnerability to changing external financing conditions," Fitch said.

    Mrs. Ngiam said there is a risk that Vietnam may loosen its policies toward a pro-growth stance in the run-up to the January 2011 national congress of the ruling Communist Party.
    "Premature easing increases the risk of macroeconomic and financial instability," she said.

    Fitch said prolonged double-digit credit extension to state and private entities underlines rising sovereign contingent liability risks posed by the banking sector.
    It forecasts the stock of private credit to reach 116% of gross domestic product in 2010, the highest stock of private credit relative to output in the B-rated category.

    Vietnam also suffers from a large budget deficit, which Fitch expects will total 7.6% of GDP in 2010, only slightly narrower than 8.7% of GDP in 2009.

    "Financing deficits of this size has proved difficult, with the government resorting to domestically-issued foreign currency instruments, raising exposure to exchange rate risk," Fitch said.

    Fitch said Vietnam's public debt increased to 45% of GDP in 2009, "eroding what had traditionally been a key rating strength, while the risk of contingent liabilities migrating to the public sector's balance sheet is high."

    The ratings firm also said that according to its Macro Prudential Risk Monitor the vulnerability of Vietnam's banking system to potential systemic stress has increased to "high" from "moderate" and now ranks E3, the lowest point on the matrix.

    A preliminary Fitch analysis based on Vietnamese accounting standards estimates a possible banking sector recapitalisation bill for the top six systemically important banks, which represent 51% of total banking sector assets, would be at least 12% of GDP, should systemic risks materialise, the ratings firm said.

    Uncertainty surrounding the banking system's asset quality is underscored by the fact that non-performing loans based on Vietnam's accounting standards often fall short of that of international accounting standards by three to five times.

    "Furthermore, domestic confidence remains sensitive to shocks, leaving the Vietnamese dong vulnerable to renewed switches into foreign exchange and gold. Further rounds of currency pressure would be negative for financial stability given the highly dollarized banking system," Fitch said.

    Fitch said Vietnam's sovereign fundamentals remain supported by strong backing from multilateral and bilateral creditors as well as significant gains in income per capita following the introduction of the "doi moi" policy in 1986.

Here's the version published on the Edge Financial Daily: Fitch downgrades Vietnam to 'B+'; Outlook Stable

And here is the 5 year chart of the VN Index.


How?

How serious is this downgrade? Could Vietnam's trouble escalate?

Now the concern for us is obviously the risks involved with our local company's exposure to Vietnam.

A couple years ago, iinm in June 2008, RHB did have a report listing out companies with exposure to Vietnam. But that might not be accurate as it's a long time ago.


ps... I am not a Sotong, so I am afraid I have zero answers to offer.

Beat The Estimates Game: K&N Buy Recommendation On HPI Resources

Do you follow the reports on Bursa's CBRS?

Link to Bursa's CBRS Research reports

I was reading through the report from K&N Kenanga on HPI Resources and since I am blogging on it, (LOL! ), I guess you can guess this posting probably isn't anything good.

:P

On 7th August 2009: K&N had a report oneBursa: Above expectations (clickable line to CBRS pdf file) K&N had a BUY recommendation.

  • BUY RM1.30 Target Price: RM1.86
    Forecast upgraded with FY10 profit projection increased by 29.7% as we factor in a higher margins taking into account the better than expected 4Q09 numbers. We also take the opportunity to introduce our FY11 projection. Recommendation is also upgraded to a BUY from a HOLD with new target price of RM1.86 based on a 30% discount to its NTA of RM2.65.

Here's HPI earnings report then: Quarterly rpt on consolidated results for the financial period ended 31/5/2009

As you can see, based on a y-y comparison, HPI earnings jumped from 11 million to 18.8 million.

And K&N earnings 'estimates' for fy 2010 was 18.9 (no growth? :P) and fy 2011 was 19.1 million. (see page 2 of the pdf file: K&N had a report oneBursa: Above expectations )

On 28th Nov 2009, HPI reported its earnings. Here's the simple compiled table.

On 3rd Novemeber 2009: K&N's resarch report for HPI was 'Above Expectations' (CBRS pdf file link) HPI had a bonus issue then and K&N recommendation was still a BUY.

  • RM1.61 (cum bonus) RM1.29 (ex- bonus) Target Price: RM1.77 (ex- bonus)
    Forecast upgrade as we model in higher margins taking into account the better economic conditions ahead. While we maintain our revenue projections for FY2010 and FY2011, our net profit projection for FY10 is raised by 22.2% to RM23.1m and FY11 by 24.3% to RM23.8m. BUY maintained with a higher target price of RM 1.77 (ex-bonus issue) or RM2.21 on a cum basis based on 4x CY2010F. The low multiple is due to the stock’s small cap status and potential cyclical earnings.

Ok, HPI's Q1 earnings was 6.341 million and on an annualised basis, HPI's earnings could easily reach 25 million. So KN's upgrade in net profit projection was expected.

20th Jan 2010, HPI reported its Q2 earnings.


Ytd net profit already 12.467 million. Nearly half of K&N's net profit projection of 23.1 million.

K&N gave it a BUY recommendation and called it 'In Line with expectations. (CBRS pdf file link. )

  • BUY RM1.47 Target Price: RM2.21
    Forecast is maintained but target price raised to RM2.21 from RM1.77 previously, ascribing a 5x CY2010F as opposed to 4x earlier. The recent multiple expansion experienced by our driven by an improving economic outlook prompts us to use a higher multiple to value the stock. BUY maintained.

Earnings forecast for fy 2010 remained at 23.1 million.

5th April 2010, HPI reported its Q3 earnings.


Ooops... now that was a 'poor' looking quarter, yes? Now on an annualised basis, it would appear that HPI would fall a bit short of estimates, eh?

So what did K&N do and say?

K&N called it 'Disappointing' but gave HPI a HOLD recommendation. (CBRS pdf file link)

  • HOLD RM1.65 Target Price: RM1.60
    Forecast trimmed given heightening risk to profitability. While maintaining our topline forecast, margins are lowered as we factor in a tougher environment going forth. Re-pricing of its end products could lag the commodity and currency cycles in the near term. Lowering our net forecast by 22% to RM18m for FY10 and another 32% for FY11 to RM16.2m. Target price lowered to RM1.60 based on revised 5x CY10F. Recommendation also downgraded to HOLD from BUY.

oO

Net earnings lowered back down to 18 million and most interestingly, K&N lowered the fy 2011 earnings forecast to just 16.2 million.

A couple days ago, HPI announced its earnings.


Net earnings came in at 7.244 million. That was decent, yes?

Anyway, this meant that HPI easnings for fy 2010 was 22.843 million.

But K&N had already lowered its earnings forecast to just 18 million. LOL!

And on today's report on eBursa, K&N gave HPI back a BUY call rating! (CBRS pdf file link)

( ps: HPI shares HAD ALREADY rallied ( rocketed to the orbit is a better word :P ) to some 1.84! You need to check out the chart at the bottom of the posting :P)

The first paragraph... :P

  • FY10 results were above our expectations. While 12M10 revenue of RM372.6m was in line, net profit of RM22.8m was trending 27% higher due to a strong uptick in the last quarter on the back of stronger margins. Gross margins improved by 42 basis points to 17.8% in 4Q10 from a disappointing 3Q10 after an effective cost pass-through underpinned by higher paper prices in general.

LOL! Of course it was above their expectations since the expected net earnings was revised and reduced so much lower! From 23.1 million, the earnings estimates was just lowered to 16.2 million.

Yeah... as they say... HPI beat the earnings estimates.. results were above expectations!

LOL!

  • BUY RM1.84 Target Price: RM2.89
    Forecast upgrade with FY11F net profit raised by 58% mainly on the back of higher margins as sumed. We also introduce our FY12F with revenue of RM447m and net profit of RM28.8m. More engaging management with the investment community, improved transparency couple with the undemanding valuations should be positive re -rating catalysts. Dividend of 5sen (tax exempt) declared which is a pleasant surprise, yielding 2.7%. Risks remained with the volatile paper prices which accounts for 70% of its cost of production which could impact profitability depending on timing and effectiveness of any cost pass through. Upgrading call to BUY with a new target price o RM2.89 on 6x FY11F.

And K&N raised the fy 2011 estimates by 58%!!!!!

LOL!

So fy 2011 estimates... from a net earnings of just 16.2 million, K&N has now raised it to 25.7 million!

No wonder the buy recommendation now comes with a very chunky target price of rm 2.89!

And apparently this is how 'the beat the earnings estimates' is being played..... worldwide. :P


ps. I dunno if this share can or not. LOL!

ps. And I dunno if K&N owns any Sotong. :P

Some Comments On SJ Asset Management's 15.7% Stake In Maxbiz

In the following article on Star Business, SJAM licence revoked , one statement caught my attention.

  • SJAM is reported to hold a 15.7% stake in PN1-company Maxbiz Corp Bhd, which is a garment manufacturer.

Hmmm... SJ Asset Management held such a big stake in Maxbiz?

Yeah Maxbiz is the company that in July 2009 claimed that some 40 million in ASSets went missing! No Joke! See Honey Did You See My Missing 40 Million Assets? and Maxbiz: The Dog Ate My Assets!

Now I have decided to dig up some history on Maxbiz.

It was way back in December 2002 when Maxbiz proposed to be the shining White Knight for financial distressed company GEAHIN ENGINEERING BERHAD

That RTO was completed by end 2004.

Here's an old article describing Maxbiz.

  • Maxbiz: Steel fabrication a potential core business
    By DALILA ABU BAKAR

    MAXBIZ Corp Bhd, which is taking over the listing status of Geahin Engineering Bhd under a restructuring scheme, has charted a business plan for the new entity to follow its listing on the main board of Bursa Malaysia Bhd next month.

    Managing director Nor Aminudin Nor Rahmat said the company, whose core businesses are in precision dyeing and garment manufacturing, will also look at steel fabrication as another core business.

    The company, which manufactures for export, supplies its women’s and men’s apparel to Wal-Mart, Charles Vogele, St Walter, Harley Davidson and Champion, an established brand name in the US. Maxbiz exports to the US, Europe, Denmark, Germany, Japan and West Asia.

    “After listing, we’ll be looking at steel fabrication. We are deeming that a zero contribution to Maxbix now but once listed, we’ll be able to chart the business growth under the stewardship of the new management.

    “We’ll be able to see what are the prospective earnings for the group,” Nor Aminudin told Business Times.

    Maxbiz bought the steel fabrication factory in Malacca from Geahin but it does not form a premium for the listing status.

    “We’re merely buying assets and we’re paying RM22.6 million via an issuance of Redeemable Convertible Secured Loan Stock (RCSLS) to the creditors of Geahin for this,” he said.

    Nor Aminudin plans to expand the steel fabrication business and cater to its non-traditional markets in marine, shipping, and the oil and gas fields.

    “As a business entity, we are continuously looking at every aspect. Competition is real under the borderless regime. You have to be at least half a step ahead of the competitors.

    “So, we have all the reasons to believe that we will likely approach some variations of this business, having understood the track record and feasibility of the steel fabrication business,” he said.

    “Historically, this business has been focused on civil, infrastructure and building. We believe that it can be expanded, perhaps, into marine, shipping, oil and gas which are the extension of the business.”

    Under the restructuring, Maxbiz agreed on a premium and a consideration of Geahin’s listing status valued at RM20 million via the issuance of 20 million new ordinary shares of Maxbiz to creditors of Geahin.

    The scheme also entails a capital reduction of 10 to 1 shares at Geahin, whereby the paid-up capital will be reduced to about RM2 million from about RM20 million. Maxbiz will issue 2 million shares to Geahin shareholders pursuant to the capital reduction and, as a result, the paid-up capital will stand at RM22 million.

    Maxbiz then acquired MKK Industries Sdn Bhd and Mayford Garments Sdn Bhd for RM120.231 million, and with this, the total paid-up capital stands at RM142.231 million of Maxbiz shares, which qualifies the company to be on the main board.

    The enlarged paid-up capital of Maxbiz will be eventually RM164.831 million upon conversion of the RCSLS. The scheme also entails an issue of 3 million Redeemable Unsecured Loan Stock (RULS).

    “We applied for a transfer from the second board to the main board, which has been approved,” Nor Aminudin said.

    After the listing, Maxbiz’s three substantial major shareholders will be Capital Line Sdn Bhd, Inno-Option Sdn Bhd and Lim Lay Kian.

    Besides Nor Aminudin as the managing director, the board members will be Datuk Wan Ismail Abdul Rahman (chairman), Mohammad Zahar Zain (executive director), Datuk Zolkepli Abdul, Datuk Harun Siraj, Chon Chye @ Chon Chong On and Lim Lay Kian.

    Nor Aminudin said Maxbiz is looking for new advanced technology in sync with its goal to be among the most advanced technology-based textile manufacturers in Malaysia. The company has two factories in Sri Gading, Batu Pahat, Johor.

    He said Maxbiz wants to penetrate the domestic market and is currently looking at the possibility of acquiring non-listed companies in the garment business to realise its plan.

    “For the domestic market, we’re looking at acquisitions and we’ve been talking to a few potential parties that have approached us.

    “We can either grow organically or through acquisitions, but in our case, time does not permit us to grow organically. It’s still at a preliminary stage ... not finalised yet,” he added.
    Nor Aminudin also said the company, which uses innovative and high-technology machinery such as robots for high efficiency in production, will invest about RM20 million in machinery or its factories.

    It has purchased a set of finishing machines for between RM12 million and RM15 million which will be delivered in December this year. It is looking at buying a bigger broiler, priced at about RM4 million which uses wastage burning instead of oil in line with the company’s environmentally-friendly principle. In addition, the company needs about RM3 million for its laboratories.

    “These machines will enable us to upgrade our quality and provide better service to our customers. It will also lead to cost-saving,” Nor Aminudin said.

    With all these measures in place, he believes that Maxbiz can retain and improve its business, particularly in quality precision next year when liberalisation comes into play. “We have to double our market, double the turnover,” he said.

    Asked why Maxbiz chose to be a white knight for Geahin, Nor Aminudin said: “Because of the profile of its creditors, its management and owners ... the readiness of Geahin. We were not particularly concerned about its business as we, the white knight, were focusing on the listing status,” he added.

A company whose core business is precision dyeing and garment manufacturing but reckons that steel fabrication could be a potential core business.

( Yeah... !!!!..... exactly! )

You know.. Uncles always argue that if a company business is really good, then it should never have a problem listing directly. White knight companies? They tend to be problematic!

Anyway... Maxbiz was listed.

Feb 2005: Quarterly rpt on consolidated results for the financial period ended 31/12/2004 - Maxbiz recorded some 12.695 million of profits for fiscal year 2004. ( Rather too early to pass judgement, yes?)

First warning came in Oct 2005.

  • Maxbiz defaults on RM3m loan stock redemption

    October 27 2005

    The company says it was unable to make the payment of because it has not been able to recover debts amounting to RM5.7 million from Geahin Engineering

    MAXBIZ Corp Bhd, a manufacturer of fabric and textile products, has defaulted on the redemption of its RM3 million loan stocks.

    Under a trust deed, Maxbiz should have redeemed RM1.5 million on October 7, 2005, the first anniversary date of the two-year loan stocks.

    In its filing to Bursa Malaysia Bhd the company said it was unable to make the payment because it has not been able to recover debts amounting to RM5.7 million due from account receivables from Geahin Engineering Bhd.

    The company had initially planned to use the recovered debts from Geahin to redeem the redeemable unsecured loan stocks (RULS) which carry a 5 per cent coupon.

    However, this could not be done because it has not been furnished the necessary documents needed from Geahin for Maxbiz to make the necessary claims from debtors.

???? LOL! And it's only 3 million!

Feb 2006: Quarterly rpt on consolidated results for the financial period ended 31/12/2005 - Maxbiz recorded some 2.833 million in losses for fiscal year 2005. Previous year net profit was adjusted down to 12.205 million. This is understandable as these are just unaudited numbers.

Feb 2007: Quarterly rpt on consolidated results for the financial period ended 31/12/2006 - Maxbiz recorded some 6.526 million in losses for fiscal year 2006. Previous year net losses is adjusted to up 3.026 million.

Feb 2008: Quarterly rpt on consolidated results for the financial period ended 31/12/2007 - Maxbiz recorded some 22.007 million in losses for fiscal year 2007. Previous year net losses is adjusted up to 6.760 million.

Feb 2009: Quarterly rpt on consolidated results for the financial period ended 31/12/2008 - Maxbiz recorded some 6.827 million in losses for fiscal year 2008. Previous year net losses is adjusted down to 21.945 million

LOL! Putting such earnings performance into perspective, it's not that big of a shocker regarding its missing 40 million in assets!

Feb 2010: Quarterly rpt on consolidated results for the financial period ended 31/12/2009 - Maxbiz recorded some 2.904 million in losses for fiscal year 2008. BUT... but... the previous year net losses is adjusted up to 76.926 million!!!!!!!!!!!!!!

WOW!

Wiki Wiki!

And SJ Asset Management Sdn Bhd (SJAM) is a fund management?

Now I really would like to see its reasoning why it (SJAM) concluded that Maxbiz is worth an investment!

How Telekom Malaysia Stands To Reap A Tidy RM252 million If It Accepts Measat Global Offer?

What a bloody insult to one's intelligence!

From today's Business Times:

  • Measat Global said it did not plan to maintain MGB's listed status on the stock exchange.MGB's second largest shareholder, Telekom Malaysia Bhd, which held a 15.4 per cent stake as at April 26 this year, stands to reap a tidy RM252 million if it accepts the offer.... ( Read more: Measat gets RM4.20 a share buyout offer )

What does the 'stands to reap a tidy rm 252 million' means?

Seriously!

How difficult is it to search for Telekom Malaysia's cost of investment in Measat Global?

How many clicks?

Let me count for you...

  1. Bursa website to search for companies announcements
  2. Click on Archives
  3. Click on BY COMPANY
  4. Click T for Telekom
  5. Click On TELEKOM MALAYSIA
  6. Search for Measat.

6 Clicks of the Mouse. How difficult can it be? I dunno but apparently it sure is difficult!

And from this 6 clicks, we have....

TELEKOM MALAYSIA BERHAD ("TM") :- PROPOSED ACQUISITION OF 60,024,010 ORDINARY SHARES OF RM0.78 EACH REPRESENTING APPROXIMATELY 15% OF THE EQUITY INTEREST IN MEASAT GLOBAL BERHAD ("MGB") FOR A TOTAL PURCHASE PRICE OF RM250,000,000.

Yup Telekom Malaysia cost of investment in Measat Global in December 2003 was 250 Million.

  • The Proposed Acquisition involves 60,024,010 ordinary shares of RM0.78 each at a price of RM4.165 per share representing approximately 15% of the equity interests in MGB for a total purchase price of RM250,000,000.

Price? rm 4.165 sen.

If Telekom Malaysia decides to cash in this insane offer of 4.20 per share, Telekom Malaysia would get back 252 million.

A profit of 2 million.

And during this period... Measat Global paid ZERO dividends.

So tell me... what exactly does the financial reporter means by Telekom Malaysia 'stands to reap a tidy RM252 million if it accepts the offer'????

Glee!

I would be seriously offended and pissed if I was a Telekom Malaysia minority shareholder!

Seriously!

Postings on Measat Global's privatisation:

  1. The Delisting Of Measat Global at RM 4.20
  2. The Delisting Of Measat Global at RM 4.20: Part II

The Delisting Of Measat Global at RM 4.20: Part II

Posted last night: The Delisting Of Measat Global at RM 4.20

Let's compare Measat Global in 2003 and now. :D

Here's a copy of Measat Global when it was relisted back in December 2003.

Measat Global Relisting Notes 2003: Surf88
Surf 88 (a local investment advisory company back then - which no longer exist) gave a forecast earnings of 12.9 million for Measat's fy 2003 and a earnings of 39.4 million for its fy 2004. ( See page 3)

Remember it's just a forecast. It could be wrong. :D

Here'e the forecast numbers again for easier reference.


Look at the two arrows at the bottom of the table.

Measat at a price of 4.65 was trading at 140x earnings multiple (PE) and if Measat's earnings triples from 12.9 to 39.4 million, Measat at 4.65 would be trading with an earnings multiple (PE) of 46x!!!

Yeah... holy cow!

Life is good.

Wasn't it nice that during the relisting process, as stated in the news article attach to the posting The Delisting Of Measat Global at RM 4.20

  • Controlling shareholder Measat Global Network Systems Sdn Bhd (MGNS), which in turn is controlled by tycoon T. Ananda Krishnan, had placed out the shares. The buyers were fund managers who forked out RM4.25 per share.

And how did Measat fared: Quarterly rpt on consolidated results for the financial period ended 31/12/2003: Loss 1.806 million. (hmmm.. no wonder shares literally died after relisting - see chart here )

A year later: Quarterly rpt on consolidated results for the financial period ended 31/12/2004 - Measat made only 14 million! ( No wonder the share continued to plunge yes!!! ) (LOL! Looks like Surf 88 numbers were way off the mark!)

Now I wouldn't use that earnings as a point of reference because Measat just was relisted., hence I think the following year's Q4 earnings would be a much better point of reference.

Here's Measat Global's balance sheet as at 31/12/2004.

Well, I would use this as my point of reference - Measat Global was sold to fund managers back in 2003 at a price of 4.25.


April 2005.

  • New satellite to boost Measat profit
    By HO SIEW YEE

    April 14 2005

    MEASAT Global Bhd’s third satellite, Measat-3, is expected to provide major earnings growth to the company from financial year 2006 onwards.

    K and N Kenanga in its research note said the new satellite, set to be launched in the third quarter of 2005, will bring different dimensions to Measat’s earnings profile by covering about 110 countries and 70 per cent of the world population.

    The research house maintains its “hold” call on the company.

    It forecasts Measat’s revenue for the period ending December 31 this year to be RM186.1 million and net profit to be RM25.1 million. The company recorded a revenue of RM129.6 and profit of RM14 million in 2004.

    The satellite will expand Measat’s current market from East Asia to include South Asia, West Asia, East Africa and the Asia-Pacific region.

    Measat-3 is said to double the current transponder capacities of both Measat-1 and Measat-2.

    This enables the company to extend its customer base to key international broadcasters such as BBC and to meet the clients’ increasing requirements for DTH (direct-to-home), broadband, remote connectivity and multimedia services.

    The research house believed one of the reasons for the underperformance of Measat’s share price in the past one year was due to the delay in the launch of Measat-3.

    The satellite was supposed to start operating by the second quarter of this year.

    K and N Kenanga, however, expects the share price to be re-rated in the longer term given the successful launching of the new satellite.

    Measat is also currently working towards securing more broadcasting customers with the launch of its Teleport and Broadcast Centre in Cyberjaya this month.

    The research house valued Measat based on a discounted cash flow (DCF) basis to factor in the long-term nature of its business.

    “Based on DCF, we peg current value of Measat at RM4.42,” it said.

    Measat is also currently finalising the negotiations for Measat-4 and is expected to conclude the agreement by 2005. This satellite will be co-located with Measat-3 to provide additional capacity and in-orbit satellite redundancy, required by key customers.

K&N Kenanga Research then forecast a net earnings of 25 million for Measat for its fiscal 2005.

LOL!

Ooops! I laughed. I guess you can also guess that Measat did shitty that year too!

Sure it did.

It made only 14.799 million. Quarterly rpt on consolidated results for the financial period ended 31/12/2005

Let's think about it..... :P

Let's say we think about what's happening from Telekom's Malaysia perspective.

From the article posted on yesterdays blog posting: The Delisting Of Measat Global at RM 4.20 ...

  • Then, on Thursday, Telekom Malaysia Bhd said it had paid MGNS RM250 million cash (RM4.165 per share) for a 15 per cent strategic stake in Measat Global.

The past two fiscal years, Measat Global was only making an eps of 3.60-3.80.

And Telekom Malaysia was sold Measat Global shares during its relisting at a price of 4.165!

LOL!

I am so sorry but how could I really not laugh?

From an PE earnings valuation, that meant Telekom Malaysia bought Measat shares at an earnings multiple (PE) of 109x!!!

And here is the chart of Measat again...


Yup... Measat even hit a low of 0.905 on 16 March 2009.

Now if one had bought after then.. naturally Measat Global is the best stock ever in the whole orbit. Even no Moo Moo Cow's can jump into the orbit like how Measat did.

And Measat's earnings... it did recover very nicely.

No wonder the share price flew also.

Here's Measat last reported earnings in May 2010: Quarterly rpt on consolidated results for the financial period ended 31/3/2010

Measat only made some 49.792 million for the current quarter!!!!!!!


aaahhhhh....

Now we can do some simple comparison.

When Measat was listed... at best it ONLY made some 14 million. Measat this quarter alone (YES ONE QUARTER) already made some 49.792 million million.

How?

Back in December 2003, in its relisting, Measat Global was sold at 4.25.

Measat today? It wants to delisted at 4.20!!!

Make any sense at all?

In 2003... hardly any earnings. EPS for fy 2004 was only 3.6 sen. Sold at PE multiples of over 100.

Now? Measat Global's fiscal 2010 Q1 eps is already 12.7 sen!!!!

Now it would be a terrible insult to me and my fingers if I have to answer if this privatisation is fair or an insane rip off!

I did not know they had pirates in the orbit!!!!!

Apparently I am so wrong!

Wednesday, July 28, 2010

The Delisting Of Measat Global at RM 4.20

It was a long time ago.

6 December 2003. On Star Business.

  • Saturday December 6, 2003
    Back in Orbit

    BY ERROL OH

    Measat Global has given the market quite a bit to digest just before it resumes trading on Monday. Will investors warm up to the counter and do they understand enough about the business to accord its shares a fair value?

    AFTER more than 16 months of suspension, the shares of Measat Global Bhd will resume trading this Monday. All eyes, of course, will be on the price performance. Things are made more interesting because a couple of developments last week have handed the market quite a bit to digest over the weekend.

    Question is, once the investors have mulled things over, will they warmly welcome back the counter, or will they give it the cold shoulder?

    First came the announcement last Tuesday that a private placement involving 80 million shares had enabled Measat Global to meet the Kuala Lumpur Stock Exchange's listing requirements on 25 per cent public shareholding spread. It was this matter that had necessitated the counter's suspension in July last year.

    Controlling shareholder Measat Global Network Systems Sdn Bhd (MGNS), which in turn is controlled by tycoon T. Ananda Krishnan, had placed out the shares.
    The buyers were fund managers who forked out RM4.25 per share.

    (Following a mandatory general offer of Measat Global, MGNS ended up with more than 90 per cent equity in the former, which was formerly known as Malaysian Tobacco Company Bhd.)

    Then, on Thursday, Telekom Malaysia Bhd said it had paid MGNS RM250 million cash (RM4.165 per share) for a 15 per cent strategic stake in Measat Global.

    Observers point out that the fact that portfolio investors have paid only a 2 per cent premium to Telekom's price suggests that Measat Global shares are well-supported at that level.

    Prior to suspension, the counter was last done at RM3.84, on a day when the Kuala Lumpur Stock Exchange closed at 731 points. A lot has happened since. The global economic outlook has brightened considerably and the KLCI is now hovering at 790 points.
    The key perhaps is whether the market understands enough about the company's business to accord its shares a fair value.

    Through wholly-owned subsidiary Binariang Satellite Systems Sdn Bhd, Measat Global owns and operates commercial satellites. It has launched two satellites – Measat-1 and Measat-2 – in 1996, and plans to launch Measat-3 in the second quarter of 2005.

    Like most satellite companies, it gets the bulk of its revenue from the lease of transponders, that is, equipment on board the satellites that receives and transmits signals. As such, Measat Global's earnings are largely dependent on the utilisation of its satellites and the transponder lease rates.

    “It's complicated in terms of technology but it has a very simple business model,” says Binariang vice-president, sales and marketing, Paul Brown-Kenyon.

    It is undoubtedly a business that demands massive capital outlay – the company will eventually have spent about US$460 million to buy and launch its first three satellites – but it is also a business that promises strong cash flow and healthy growth.

    Riding the boom

    The satellite services business rides on the expansion in the telecommunications and broadcasting industries. Typically, customers sign transponder leases for three to four years, and the payments are made quarterly and in advance.

    Binariang sees itself as a regional player currently and its satellites enjoy a utilisation rate of 80 per cent. It has over 40 customers, of which 60 per cent are outside Malaysia.

    Its marketing strategy is to go for the No.1 or No.2 telco or TV company in every market and build its business from there.

    Nevertheless, its major customers are closer to home and these include Measat Broadcast Network Systems Sdn Bhd (which operates the Astro direct-to-home (DTH) service) and telecommunication companies such as Telekom Malaysia and Maxis Communications Bhd.

    Because Ananda Krishnan also controls Astro and Maxis, Binariang is perceived to be overly reliant on “in-house business”.

    Brown-Kenyon dismisses this. “Yes, Astro and Maxis are important customers, but so are Telekom Malaysia, GMA Network and Globe Telecom (both of the Philippines). We are an independent company and we sell to the regional market.”

    Rating Agency Malaysia Bhd (RAM), in a June rating review on Binariang, says the dependence on Astro and Maxis is not necessarily a bad thing. “In fact, we have a favourable view of the synergistic benefits which the company can derive from their relationship,” it wrote.

    For one thing, the two customers have their own plans for expansion and this will lead to demand for additional transponder capacity. Astro, for example, wants to add more channels and services to its offering.

    RAM also argues that Maxis and Astro are likely to remain within Ananda Krishnan's stable of companies, thus ensuring that the two companies will continue to support Binariang in the future.

    Enter Measat-3

    In any case, the perception that Binaring leans too much on Astro and Maxis may well become moot. The satellite company is banking on Measat-3 to launch it to the global stage. “With Measat-3, we're looking to extend our geographic reach and the breadth of our offering,” say Brown-Kenyon.

    Larger, more powerful and more flexible, the third satellite will have wider coverage and has deeper capacity to give customers what they want.

    Another reflection of Binariang's global ambitions is that it has secured rights to operate satellites from 16 slots around the world. It now uses only two.

    But it is not just a matter of launching one bird after another. Brown-Kenyon says Binariang wants to go beyond simple transport to provide value-added services to customers.

    At the same time, the company is looking to leverage its strength in the DTH segment. “We are today the largest DTH platform in Asia, excluding Japan. That gives us a great experience in terms of differentiating ourselves in the region,” he says.

    This is a wise move when you consider that DTH customers tend to be “sticky”. Once a DTH company signs up with a satellite operator, it tends to keep to the arrangement. A switch means having to take the expensive step of changing the direction of dishes of the TV customers to the new satellite.

    Judging from the results of the share placement, there is no shortage of believers in the Measat Global story. According to sources familiar with the exercise, the demand for the shares was strong. “People see the potential. It's a high-growth business and the pricing was attractive,' he adds.

    But the situation was different about a year ago. A similar attempt to place shares was aborted and the sagging stock market was blamed. In addition, it was felt that at that point, Measat-3 was too distant in the horizon to convince investors of its potential.

    But observers also point out that the initial public offering (IPO) of Astro All Asia Network plc may have been another factor in changing the fund managers' perceptions about Measat Global.

    Says one analyst, “The Astro IPO might have made it easier to understand how Ananda Krishnan's information and communications technology (ICT) businesses would converge. Before, people were not sure that Astro was viable. Now, many believe that Measat Global too will fare well.”

    That will be incentive enough to watch the skies. But on Monday at least, the attention will be on the trading of Measat Global shares on the KLSE

Measat opened trading at 4.60. Fell to a low of 4.12. Closed at 4.14.

That was the highest it ever traded.


To bad for the buyers who bought the placement shares at rm 4.25 per share.

Today Measat Global Networks launches takeover of Measat at RM4.20 a share

Which of course is nice for those who bought recently.


See Part II here: The Delisting Of Measat Global at RM 4.20: Part II

How To Lose Big Bucks In ETFs

Blogged last year: Which Crude Oil ETF/ETN? DXO, USO or USF?

In that posting, I mentioned the following:

Here's an article on Bloomberg worth reading: ETFs Imperil Commodity Investors When Contango Conspires With Pre-Rolling

  • Like so many investors in the spring of 2009, Gordon Wolf needed to dig out of a hole.

    A 68-year-old psychologist in Napa, California, Wolf was a buy-and-hold sort of guy, yet the nest egg he had entrusted to his broker at Merrill Lynch was suddenly down by more than 50 percent.

    The broker had invested much of it in a range of exchange- traded funds, or ETFs, a relatively new financial innovation that was replacing mutual funds in the hearts and portfolios of many investors. An ETF, which can be bought or sold like a stock, attempts to track the price of a particular basket of assets -- tech stocks, for instance, or high-yield bonds, or commodities ranging from wheat to gold to oil to natural gas.

    The commodity ETFs were supposed to offer a hedge against equity losses, but in the crash of 2008 everything fell in tandem. Now it was early 2009, and Wolf was watching oil fall to $34 a barrel. That had to be an opportunity, he figured, so he called his Merrill broker and asked about the U.S. Oil Fund, an ETF designed to track the price of light, sweet crude. “This seems to be something good,”
    Wolf told the broker, and had him buy about $10,000 of USO.

    Going Down

    What happened next didn’t make sense. Wolf watched oil go up as predicted, yet USO kept going down. In February 2009, for example, crude rose 7.4 percent while USO fell 7.4 percent. What was going on?
    Wolf logged on to Seeking Alpha, a financial blog, and searched for USO. He found plenty of angry discussion about the fund -- lots of people were losing lots of money, because thousands of American investors had seen the same sort of opportunity Wolf had.

    By the end of 2009, they had a record $277 billion invested in commodity ETFs and other securities linked to raw materials - - a 50-fold jump from $5.5 billion a decade earlier, according to Barclays Capital. During that time, Wall Street had transformed the reputation of commodities from a hyper-volatile investment that can steal your shirt to a booster for battered portfolios, something that rose when stocks fell and hedged against inflation, Bloomberg Businessweek reports in its July 26 issue. People who would never think of buying a tanker of crude or a silo of wheat could now put both commodities in their 401(k)s.
    Suddenly everybody was a speculator.

    And some were losing big. The commodity ETFs weren’t living up to their hype, and the reason had to do with a word Wolf had never heard before. As he browsed the blogs, he says, “I’m seeing people talking about something called contango. Nobody would define it.” Wolf called his broker and asked about contango.

    ‘Rigged Game’

    “I don’t know what it is,” he replied. He called his other broker, at Charles Schwab. “He didn’t know either,” Wolf says. “He said he’d ask around.” Weeks later, after Wolf educated himself, he fired his Merrill broker and pulled out his money. (Merrill and Schwab declined to comment.) By then he had lost $2,500 on USO. “If it wasn’t a rigged game,” he says, “I could figure it out. But it is a rigged game.”

    Contango is a word traders use to describe a specific market condition, when contracts for future delivery of a commodity are more expensive than near-term contracts for the same stuff. It is common in commodity markets, though as Wolf and other investors learned, it can spell doom for commodity ETFs.

    Futures Roll

    When the futures contracts that commodity funds own are about to expire, fund managers have to sell them and buy new ones; otherwise they would have to take delivery of billions of dollars’ worth of raw materials. When they buy the more expensive contracts -- more expensive thanks to contango -- they lose money for their investors. Contango eats a fund’s seed corn, chewing away its value.

    Here’s an example. The Standard & Poor’s Goldman Sachs Commodity Index (S&P GSCI), which tracks 24 raw materials, is the basis for as much as $80 billion of investment. Managers of funds linked to the index, created by Goldman in 1991, have to buy their next-month futures contracts between the fifth and the ninth business day of each month.

    During that period in May, fund managers sold contracts for June delivery of crude oil priced at $75.67 a barrel, on average, according to data compiled by Bloomberg. Managers replacing those futures with July contracts had to pay $79.68. After the roll period ended, the July contract fell back to $75.43. For each of the thousands of contracts, in other words, managers paid $4 for nothing -- and the value of their funds dropped accordingly.

    Dumb Money

    Contango isn’t the only reason commodity ETFs make lousy buy-and-hold investments. Professional futures traders exploit the ETFs’ monthly rolls to make easy profits at the little guy’s expense. Unlike ETF managers, the professionals don’t trade at set times. They can buy the next month ahead of the big programmed rolls to drive up the price, or sell before the ETF, pushing down the price investors get paid for expiring futures. The strategy is called pre-rolling.

    “I make a living off the dumb money,” says Emil van Essen, founder of an eponymous commodity trading company in Chicago. Van Essen developed software that predicts and profits from pre-rolling. “These index funds get eaten alive by people like me,” he says.

    A look at 10 well-known funds based on commodity futures found that, since inception, all 10 have trailed the performance of their underlying raw materials, according to Bloomberg data. The biggest oil ETF, the U.S. Oil Fund, which Wolf bought and which now has $1.9 billion invested in it, has dropped 50 percent since it started in April 2006 -- even as crude oil climbed 11 percent.

    Gas Fund

    The $2.7 billion U.S. Natural Gas Fund, offered by the same company, has plummeted 85 percent since its launch in April 2007 -- more than double the 40 percent decline in natural gas. Deutsche Bank’s PowerShares DB Agriculture Fund has eked out a 3 percent total return since January 2007, while the weighted average of its commodity components has risen 19 percent.

    To be sure, those spot prices -- reported on cable business channels and other outlets -- set an unreachable benchmark. If investors try to match the spot market using ETFs, they can get killed by contango. If they dodge contango by buying physical commodities instead, they must pay heavy storage costs that can easily turn gains to losses.

    Investment Allure

    The allure of commodity investment has hit even the most sophisticated investors. The California Public Employees’ Retirement System, the largest public pension in the U.S., has lost almost 15 percent of an $842 million investment in commodity futures since 2007, according to its latest filings, depriving it of income at a time when it has sought taxpayer money to cover retiree benefits. It defends the investment as insurance that will pay off in the event of inflation.

    Just as they did with subprime mortgage-backed securities, Wall Street banks are transferring wealth from their clients to their trading desks. “You walk into a casino, you expect to lose money,” says Greg Forero, former director of commodities trading at UBS. “It’s the same with these products. You’re playing a game with a very high rake, a very high house advantage, and you’re not the house.”

    Selling commodity investments has long required training in the futures markets. Selling commodity ETFs doesn’t, says Michael Frankfurter, managing director of Cervino Capital Management, a commodity trading adviser in Los Angeles.

    Salesmen Unleashed

    Turning commodity futures into securities unleashed a much larger sales force -- stockbrokers selling a product many of them didn’t understand, he says. Passive buy-and-hold investors at one point in mid-2008 held the equivalent of three years of production of soft red winter wheat. Wall Street’s success in attracting those buyers boosted demand for futures contracts, which helped determine what consumers would pay for baked goods.

    Wheat prices jumped 52 percent in early 2008, setting records before plunging again, and sugar more than doubled last year even as the economy slowed, forcing Reinwald’s Bakery in Huntington, New York, to fire five of its 32 employees. “You try and budget to make money, but that’s becoming impossible to predict,” says owner Richard Reinwald, chairman of the Retail Bakers of America.

    Cocoa futures reached a 30-year high early this year because of speculators, according to Juergen Steinemann, chief executive officer of the world’s largest maker of bulk chocolate, Zurich-based Barry Callebaut. At the airport, the new $25 charge for checking a suitcase exists partly because airlines have to set aside cash to hedge against sharper ups and downs in oil prices, says Bob Fornaro, CEO of AirTran Holdings. “This has been very, very good for Wall Street,” he says.

    No Guarantees

    Sponsors of commodity ETFs and similar investments -- including Deutsche Bank AG, Barclays, and UBS -- warn of the risks in their prospectuses. Those banks declined to comment, but defenders say it’s unfair to single out returns over any specific time period. “Diversification doesn’t mean you’re always going to be up, but you spread the risk differently,” says Kevin Rich, a former Deutsche Bank executive who developed the first futures-based commodity ETFs in the U.S.

    Not every trader is comfortable with what Wall Street has done. Forero, 36, became director of commodities trading at UBS in 2007. A New Yorker whose father was Colombian consul to the U.S., he began his career at JPMorgan Securities, then worked a series of energy-trading jobs before landing at UBS’s securities division in Stamford, Connecticut, where the Swiss bank operates one of the world’s largest trading floors. UBS had bought Enron’s energy desk, so Forero sat among veterans of the disgraced company.

    Earning Commissions

    UBS sold notes linked to futures and earned commissions handling the monthly roll for clients such as USO, Forero says, adding that he didn’t do the roll himself. (“That was a different group,” he says.)

    In January 2009, stung by subprime losses that forced a Swiss government bailout, UBS shut its energy desk. Forero and his wife had a newborn daughter and a $1.2 million Colonial in Norwalk, Connecticut. With no job, Forero holed up in his home office, sifting through data with a Hewlett-Packard scientific calculator. He became convinced that the products UBS had sold were hurting investors and disrupting supply and demand for basic commodities.

    “I’ve always been a little naïve, and maybe I still am,” he says. “But how can the government allow that? People in our industry talk about it -- everybody knows about it. This has to come to light.” UBS spokesman Doug Morris declined to comment.

    Basement Revelation

    Bob Greer spent long days during the mid-1970s in the basement of a public library in Tulsa, going through rolls of microfilm. He painstakingly copied commodity prices onto yellow legal pads, then tallied them up on a handheld calculator -- piecing together the first investable commodities index. An economist and mathematician with a Stanford University MBA, Greer had worked at a commodities brokerage in Dallas, where he got the idea that raw materials might belong in investment portfolios, alongside stocks and bonds.

    Greer’s work in the library basement led to the 1978 publication of his first article on buy-and-hold commodity investing in the Journal of Portfolio Management. “Conservative Commodities: A Key Inflation Hedge” outlined the benefits of passive, unleveraged, long-only bets on raw materials. The idea didn’t catch on, and Greer went into commercial real estate.

    At the time, everyone knew someone who had gone broke betting on soybeans, or a gold bug who hoarded coins against catastrophe, he says. Commodity investing wasn’t respectable. “People did not believe that the words ‘commodity’ and ‘investment’ belonged in the same sentence,” says Greer, now 63 and an executive vice-president at Pimco in Newport Beach, California.

    Goldman Launch

    Greer had long since given up on his idea by 1991, when Goldman launched its benchmark commodity index and began selling swaps that tracked it to institutional investors. Two years later, Daiwa Securities hired him to create an index based on the one he had dreamed up in Tulsa. Commodities investing was catching on, and Greer says a breakthrough came when the tech bubble burst in 2000.

    By 2002, when the Standard & Poor’s 500-stock index plunged 25 percent, investors were desperate for alternatives. That year, Pimco hired Greer to start its Commodity RealReturn Strategy Fund. The actively managed fund has returned more than 200 percent since its debut.

    ETF Pioneer

    While Greer was launching his fund, a natural resources consultant in Australia, Graham Tuckwell, was developing the first commodity ETFs. Tuckwell had worked for Salomon Brothers, Credit Suisse First Boston, and Normandy Mining, Australia’s largest gold producer; by 2002 he was working with the Australian Gold Council, looking for a way to encourage gold investing.

    An acquaintance mentioned an oddball product: wine securities. They were “funny little things,” Tuckwell says, that allowed cases of a particular vintage to be traded on a stock exchange. He decided his fund would work the same way. Instead of cases of wine, the shares would be backed by gold bars stored in a vault.

    Tuckwell’s innovation, rolled out in 2003 and then called Gold Bullion Securities, soon became a hit, and in April 2004 a contact at Royal Dutch approached him with a question: Could he do for oil what he had done for gold? “An oil refinery takes an enormous amount of working capital because you have all this crude oil sitting there,” Tuckwell says. He went to Shell and suggested a product that would help the company make money from the crude it keeps in storage.

    Shell Deal

    Backing the oil ETF shares with the physical commodity proved unwieldy. Gold was compact and easily stored in a vault; oil was in depots, pipelines, and tankers all over the world. Instead, Tuckwell’s London firm, ETF Securities, entered into a swap agreement with Shell.

    Tuckwell used investors’ money to buy contracts from Shell, and Shell gave them the same return as crude oil, based on the price of Brent crude futures. Since the oil ETF started trading in London in 2005, Brent has risen 30 percent; the fund has dropped 27 percent. The risks are clearly outlined in the prospectus, Tuckwell says, and anyone who doesn’t understand the product first shouldn’t buy it.

    Pitching Commodities

    Banks used new academic research to pitch commodities as a safe way to diversify. In one 2004 presentation, Heather Shemilt, then a managing director and now a partner at Goldman, called the strategy “the portfolio enhancer.” That same year two professors, Gary B. Gorton of the Wharton School and K. Geert Rouwen-horst of Yale University, published a paper, funded in part by American International Group Inc., which argued that an investment in a broad commodity index would have brought about the same return as stocks from 1959 to 2004, and would often rise when stocks fall.

    Under the crystal chandeliers of San Francisco’s Palace Hotel in June 2005, Rouwenhorst presented his findings to more than 100 investment pros; Shemilt also appeared, alongside managers from Barclays and AIG. After the talk, many in the audience had the same question: How do I do this?

    Barclays, Goldman, AIG, and other firms had developed ways to help them do it -- several types of investments based on futures contracts, which had been used for almost 150 years to arrange the price and delivery of a given commodity at a specified place and date. These products remained the province of wealthy investors. In 2004, however, Deutsche Bank’s Rich devised a commodity ETF that opened the door to retail investors when it launched two years later.

    Rule Obstacle

    There was an obstacle: The U.S. Commodity Futures Trading Commission, a regulatory board created in 1974 after a runup in grain prices, required buyers of certain commodity investments to sign a statement saying they understood the risks. The banks argued that it would be impossible to collect so many thousands of signatures for a product designed to trade like a stock.

    In 2005, Deutsche Bank lawyer Greg Collett, who had worked at the CFTC from 1998 to 1999, helped persuade the commission to waive the rule and let funds replace it with their prospectus. That would provide adequate warning, the CFTC concluded. Collett says he believed the fund “democratized” commodity investing.

    Rich started attending National Grain & Feed Association conferences to introduce ETF investors to the traditional players, such as farmers and silo operators. One conference featured a boat ride up the Illinois River to visit a grain depot, giving Rich a chance to explain his new ETFs to old- school grain traders. “They were a bit suspicious,” he says.

    Aluminum Warehouses

    These days, the Wall Street banks are more like those grain traders than you might think. They have equipped themselves to take delivery of raw materials when they choose to, so they can wait for the commodity price to rise without having to roll contracts, giving them another advantage over ETF investors. Goldman owns a global network of aluminum warehouses.

    Morgan Stanley chartered more tankers than Chevron last year, according to shipbroker Poten & Partners. And JPMorgan Chase hired a supertanker to store heating oil off Malta last year, likely earning returns of better than 50 percent in six months, says oil economist Philip Verleger. “Many, many firms did this,” he adds, explaining that ETF investors created this “profitable, risk-free arbitrage opportunity” when they plowed into commodities. Futures are bilateral; if someone’s buying, someone else is selling. “And the only way to attract sellers is to offer them a bigger profit,” Verleger says. “So, ironically, passive investors have been sowing the seeds of their own defeat” -- and contributing to the contango that does in their funds.

    ‘Over-Marketed’

    Even the former Deutsche Bank lawyer who helped open the floodgates now says something has gone wrong. “Like most things on Wall Street, they have been over-marketed,” Collett says. “The complications have been glossed over. I’m not sure the people marketing them even understand the complications, and that’s a shame.” Collett left Deutsche in 2008 and is pursuing a career as a stand-up comic in New York.

    If you’re going to serve as de facto spokesman for the commodity ETF industry, it probably helps to have played college rugby. John Hyland is the chief investment officer of U.S. Commodities Funds, the Alameda, California, company that manages USO and its sister fund, U.S. Natural Gas. Majoring in political science at the University of California at Berkeley in the late 1970s, Hyland played the rugby position called hooker, which requires toughness and fancy footwork to jerk the ball out of the scrum. “My wife calls me the human battering ram,” he says. For the past year he’s been trying to keep his funds out of a regulatory pileup.

    Fresh to Commodities

    Hyland, 51, had never managed commodities before he joined U.S. Commodity Funds LLC in 2005. He had been in the investment business for 20 years -- running portfolios and mutual funds -- before he teamed up with U.S. Commodity CEO Nicholas Gerber. In 2006, as Gerber and Hyland were trying to win approval from the Securities and Exchange Commission for the U.S. Oil Fund, the fund’s prospectus hit the desk of Dan McCabe, then CEO of Bear Hunter Structured Products, which was to be the fund’s first specialist. McCabe recalls immediately spotting how traders would pick USO apart.

    “Anybody who looked at it prior knew exactly what would happen,” McCabe says. “From a trading side -- and I spent most of my life trading -- I would say, ‘Wow, what a great opportunity.’”

    After Hyland’s oil and natural gas funds surged in 2008 and 2009, he found himself in the crosshairs of the CFTC, which was holding hearings on energy speculation in the wake of $147-a- barrel oil. CFTC Chairman Gary Gensler began calling for limits on the number of energy contracts a single trader can hold. As Hyland’s ETFs became poster children for the problem, Hyland became their most vocal advocate.

    California Crude

    At an ETF conference in Boca Raton, Florida, in January, he showed up with bottles of Merlot stamped with the company logo and the words “California Crude.” The chances of pre-rolling his funds, he maintains, are “historically a 50-50 crapshoot” -- a view many traders reject. His funds track daily moves in futures prices, he continues, because spot prices are impossible to capture unless you store fuel yourself. “I don’t think the products are flawed,” he says. “They do what they say they’re supposed to do.”

    On Feb. 6, 2009 -- to cite one example -- USO did what McCabe guessed it might. It gave traders an opportunity to profit at the expense of the fund’s investors, McCabe says. With oil prices near their lowest in more than four years, long-term investors like Wolf had flocked to the fund; its monthly roll, taking place that day, had grown so large that it represented financial contracts for almost 78 million barrels of oil, roughly four times the amount of oil the U.S. consumes in a single day.

    Widening Spread

    On Feb. 6, the price spread between expiring crude oil futures and those for the following month widened by $1.39 a barrel, or 30 percent, to $5.98. The price jump was so extreme that the CFTC announced an investigation within weeks, saying it “takes seriously issues surrounding price movements in our nation’s vital energy markets.”

    In the midst of the price swing, according to an account released by the CFTC in April, a Morgan Stanley trader made a secret deal with a broker at UBS, acting on behalf of USO. Around noon, Morgan Stanley agreed to buy 33,110 of the fund’s expiring March contracts and sell it April contracts, the CFTC said. The Morgan Stanley trader asked UBS to keep the trade quiet -- a violation of New York Mercantile Exchange (Nymex) rules -- until after the 2:30 p.m. close of trading that day.

    Secret Deal

    The secret deal was breathtakingly large, equivalent to 12 percent of March futures on the Nymex. At the end of the day, USO and its investors lost because of the extreme contango: They could afford fewer of the more expensive April futures than they had in March, Forero says after analyzing Bloomberg data. Buying the same amount of oil would have cost $466 million more, he estimates. “You can either get screwed out of money or you can get screwed out of product,” he says. “They had to pay more for effectively the same barrels.”

    The CFTC told the oil fund it may be held “vicariously liable” for UBS’s actions, according to a March filing with the SEC. Hyland says he knew nothing about the deal. In April the CFTC ordered a $14 million civil fine for Morgan Stanley and $200,000 for UBS for failing to report the trade as required. The CFTC declined to explain how it arrived at the amounts or to disclose Morgan Stanley’s profit. “Morgan Stanley fully cooperated with the CFTC and is pleased to have reached a resolution with our regulator,” says company spokeswoman Jennifer Sala. “This matter concerned an isolated request by a former Morgan Stanley trader.”

    Revealing Risks

    Without knowing Morgan Stanley’s trades, Hyland says, it’s hard to determine whether the bank’s actions harmed investors. “The best that you can do as the provider of investment products is lay out, in as much detail as you think people can absorb, the hows, the whys, and the risks,” he says. Page five of the fund’s 86-page prospectus includes this disclaimer: “The price relationship between the near month contract to expire and the next month contract to expire _ will vary and may impact both the total return over time _ as well as the degree to which its total return tracks other crude oil price indices’ total returns.”

    Hyland’s other main fund, U.S. Natural Gas (UNG), got so big last year that at its peak it owned the equivalent of 86 percent of the near-month natural gas contracts on the Nymex. As natural gas prices fell into the basement -- traders call the notoriously volatile market “The Widowmaker” -- UNG fell with them, and when gas prices rallied, UNG did not.

    Regulator Concerns

    The fund’s growth raised concerns among regulators at the CFTC, which last year began debating position limits; it will revisit the issue this year. The fund grew so large it had to freeze its position and start buying over-the-counter derivatives -- unregulated contracts tied to gas prices -- instead of futures. Hyland told the CFTC last year that it was “gibberish” to say UNG had any effect on natural gas prices.

    The financial reform bill President Barack Obama signed on July 21 includes a few provisions that may help the CFTC address the commodity ETF mess. The new regulations enhance the CFTC’s ability to prosecute trading abuses, and set position limits on over-the-counter swaps, like those UNG has been buying. How much the new law will help remains to be seen, says Jill E. Sommers, one of the agency’s five commissioners, because Congress still needs to appropriate funds and write guidelines for implementation and enforcement. “We’ll need additional dollars to carry this out,” she says, adding that it’s too early to say whether the CFTC has the authority needed to crack down on pre- rolling. “We’re at the beginning of the rule-writing process, so it’s premature to say whether additional authority is going to be needed,” she says.

    Supersized Role

    By requiring the commission to impose caps on energy trading within a year, the rules may limit the size of some funds. It does nothing to directly address the market impact of the funds, says CFTC commissioner Bart Chilton. He likens ETF investors’ supersized role to the one Tom Hanks played in the 1988 film Big -- a little boy in a man’s body. “The dynamics of the market have changed so dramatically over the last several years with this new influx of capital that is massive in size and passive in strategy,” Chilton says. “That has had an impact that wasn’t anticipated.”

    The CFTC’s explicit responsibility is to guard against commodity market distortions, not to look out for ETF investors like Gordon Wolf. “We are concerned about both,” says Sommers. Adds Gensler: “The CFTC is aggressively using its authority to police the markets for fraud, manipulation, and other abuses. Investors also should fully research any products before they buy.” As Hyland likes to point out, the risks are described in each fund’s prospectus.NNow investors are learning what those words actually mean.

Here's the chart of USO when I made the posting.. Which Crude Oil ETF/ETN? DXO, USO or USF? ( It was trading at US 40.00)


And here's the chart of USO now... USO last traded at USD 34.67!!!


Quote:

  • ... watched oil go up as predicted, yet USO kept going down.

    The scary DIVE in May 2010. :P